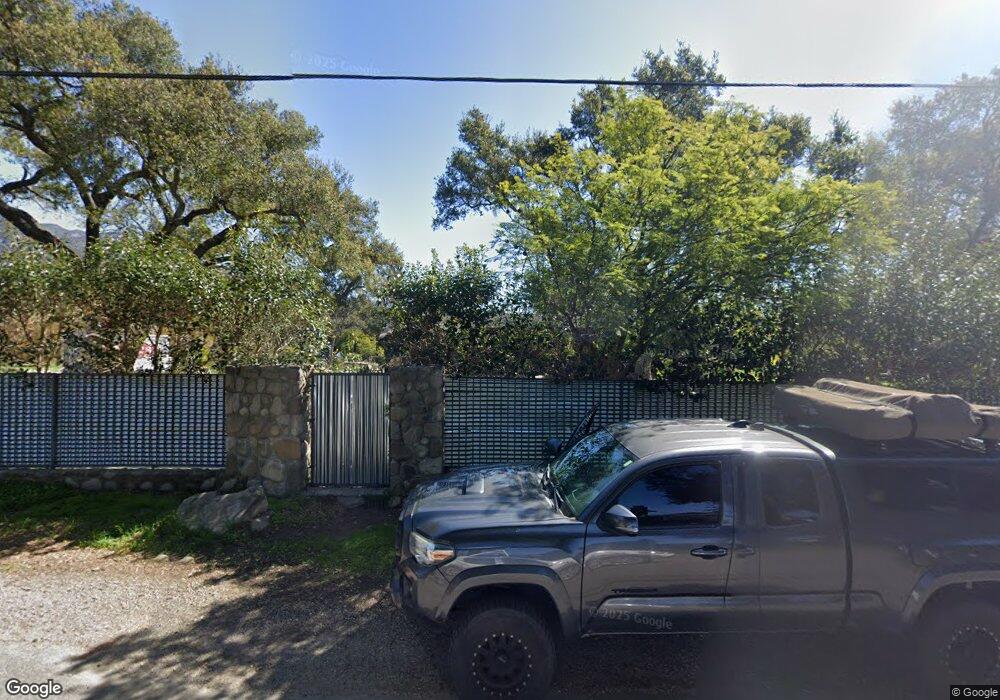
832 Oso Rd Ojai, CA 93023
Mira Monte NeighborhoodEstimated Value: $749,000 - $1,878,505
4
Beds
4
Baths
2,542
Sq Ft
$599/Sq Ft
Est. Value
About This Home
This home is located at 832 Oso Rd, Ojai, CA 93023 and is currently estimated at $1,522,376, approximately $598 per square foot. 832 Oso Rd is a home located in Ventura County with nearby schools including Meiners Oaks Elementary School, Mira Monte Elementary School, and Matilija Junior High.
Ownership History
Date
Name
Owned For
Owner Type
Purchase Details
Closed on
Sep 19, 2014
Sold by
Radchenko Vladlen and Radchenko Gladys
Bought by
Armstrong William and Nardini April
Current Estimated Value
Home Financials for this Owner
Home Financials are based on the most recent Mortgage that was taken out on this home.
Original Mortgage
$735,000
Outstanding Balance
$561,232
Interest Rate
4.07%
Mortgage Type
New Conventional
Estimated Equity
$961,144
Purchase Details
Closed on
Apr 9, 2013
Sold by
Radchenko Vladlen and Radchenko Gladys C
Bought by
Radchenko Vladlen and Radchenko Gladys
Create a Home Valuation Report for This Property
The Home Valuation Report is an in-depth analysis detailing your home's value as well as a comparison with similar homes in the area
Home Values in the Area
Average Home Value in this Area
Purchase History
| Date | Buyer | Sale Price | Title Company |
|---|---|---|---|
| Armstrong William | $935,000 | Consumers Title Company | |
| Radchenko Vladlen | -- | None Available |
Source: Public Records
Mortgage History
| Date | Status | Borrower | Loan Amount |
|---|---|---|---|
| Open | Armstrong William | $735,000 |
Source: Public Records
Tax History Compared to Growth
Tax History
| Year | Tax Paid | Tax Assessment Tax Assessment Total Assessment is a certain percentage of the fair market value that is determined by local assessors to be the total taxable value of land and additions on the property. | Land | Improvement |
|---|---|---|---|---|
| 2025 | $7,111 | $664,617 | $384,590 | $280,027 |
| 2024 | $7,111 | $651,586 | $377,049 | $274,537 |
| 2023 | $6,863 | $638,810 | $369,656 | $269,154 |
| 2022 | $6,731 | $626,285 | $362,408 | $263,877 |
| 2021 | $6,704 | $614,005 | $355,302 | $258,703 |
| 2020 | $6,535 | $607,710 | $351,659 | $256,051 |
| 2019 | $6,333 | $595,795 | $344,764 | $251,031 |
| 2018 | $6,286 | $584,113 | $338,004 | $246,109 |
| 2017 | $6,152 | $572,661 | $331,377 | $241,284 |
| 2016 | $6,045 | $561,433 | $324,880 | $236,553 |
Source: Public Records
Map
Nearby Homes