A
Landlord's Agent in 2016
Artrese Payne
Beacon Property Mgmt & Realty

Estimated Value: $267,000 - $387,000
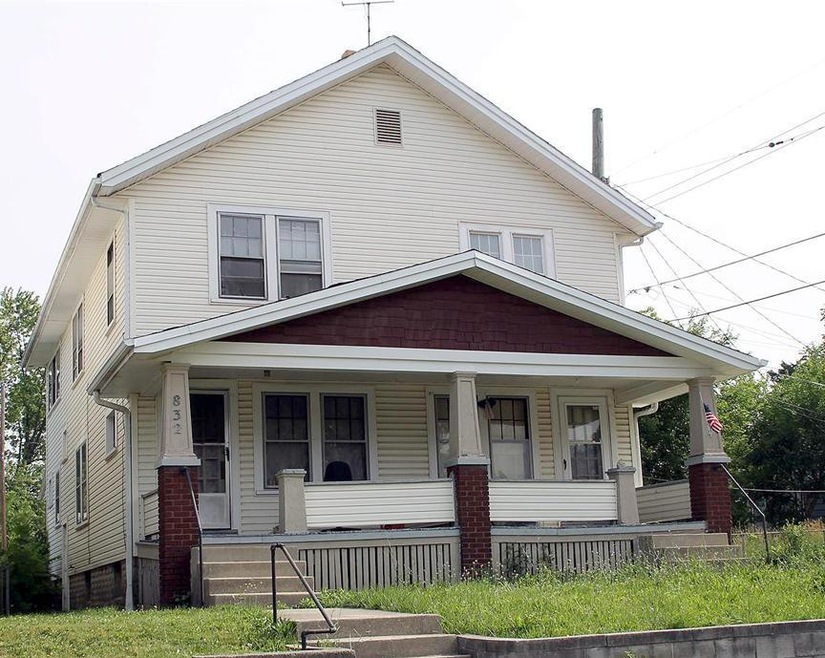
This home is located at 832 Siebert St Unit 834, Columbus, OH 43206 since 22 July 2016 and is currently priced at $310,753. This property was built in 1929. 832 Siebert St Unit 834 is a home located in Franklin County with nearby schools including Livingston Elementary School, South High School, and South Columbus Preparatory Academy.
Last Agent to Rent the Property
Artrese Payne
Beacon Property Mgmt & Realty Listed on: 07/22/2016
Last Renter's Agent
Brian Ambrosio
Keller Williams Excel Realty License #2017004022
| Date | Buyer | Sale Price | Title Company |
|---|---|---|---|
| Patriarch Bt Investments Llc | -- | Chase Title | |
| Patriarch Bt Holdings Llc | $48,500 | Chase Title | |
| Gantner James G | $50,400 | Valmer Land | |
| Krauss Roman | -- | -- |
| Date | Event | Price | List to Sale | Price per Sq Ft | Prior Sale |
|---|---|---|---|---|---|
| 03/27/2025 03/27/25 | Off Market | $625 | -- | -- | |
| 08/22/2016 08/22/16 | Rented | $625 | 0.0% | -- | |
| 07/23/2016 07/23/16 | Under Contract | -- | -- | -- | |
| 07/22/2016 07/22/16 | For Rent | $625 | 0.0% | -- | |
| 11/18/2015 11/18/15 | Sold | $48,500 | -11.7% | $21 / Sq Ft | View Prior Sale |
| 10/19/2015 10/19/15 | Pending | -- | -- | -- | |
| 09/20/2015 09/20/15 | For Sale | $54,900 | -- | $24 / Sq Ft |
| Year | Tax Paid | Tax Assessment Tax Assessment Total Assessment is a certain percentage of the fair market value that is determined by local assessors to be the total taxable value of land and additions on the property. | Land | Improvement |
|---|---|---|---|---|
| 2025 | $3,903 | $85,160 | $23,000 | $62,160 |
| 2024 | $3,903 | $85,160 | $23,000 | $62,160 |
| 2023 | $3,854 | $85,155 | $22,995 | $62,160 |
| 2022 | $1,609 | $30,280 | $5,530 | $24,750 |
| 2021 | $1,612 | $30,280 | $5,530 | $24,750 |
| 2020 | $1,614 | $30,280 | $5,530 | $24,750 |
| 2019 | $1,449 | $23,310 | $4,270 | $19,040 |
| 2018 | $1,343 | $23,310 | $4,270 | $19,040 |
| 2017 | $1,405 | $23,310 | $4,270 | $19,040 |
| 2016 | $1,360 | $20,020 | $3,430 | $16,590 |
| 2015 | $1,238 | $20,020 | $3,430 | $16,590 |
| 2014 | $1,241 | $20,020 | $3,430 | $16,590 |
| 2013 | $645 | $21,070 | $3,605 | $17,465 |
A
Landlord's Agent in 2016
Artrese Payne
Beacon Property Mgmt & Realty
B
Tenant's Agent in 2016
Brian Ambrosio
Keller Williams Excel Realty
N
Seller's Agent in 2015
Nicholas Gabbard
E-Merge
B
Buyer's Agent in 2015
Brian Munk
Parker Realty Associates
Source: Columbus and Central Ohio Regional MLS
MLS Number: 216026942
APN: 010-028948
Disclaimer: Certain information contained herein is derived from information provided by parties other than Homes.com. All information provided is deemed reliable, but is not guaranteed to be accurate and should be independently verified.
![]() IDX information is provided exclusively for personal, non-commercial use, and may not be used for any purpose other than to identify prospective properties consumers may be interested in purchasing.
IDX information is provided exclusively for personal, non-commercial use, and may not be used for any purpose other than to identify prospective properties consumers may be interested in purchasing.
Information is deemed reliable but not guaranteed.
Ask me questions while you tour the home.