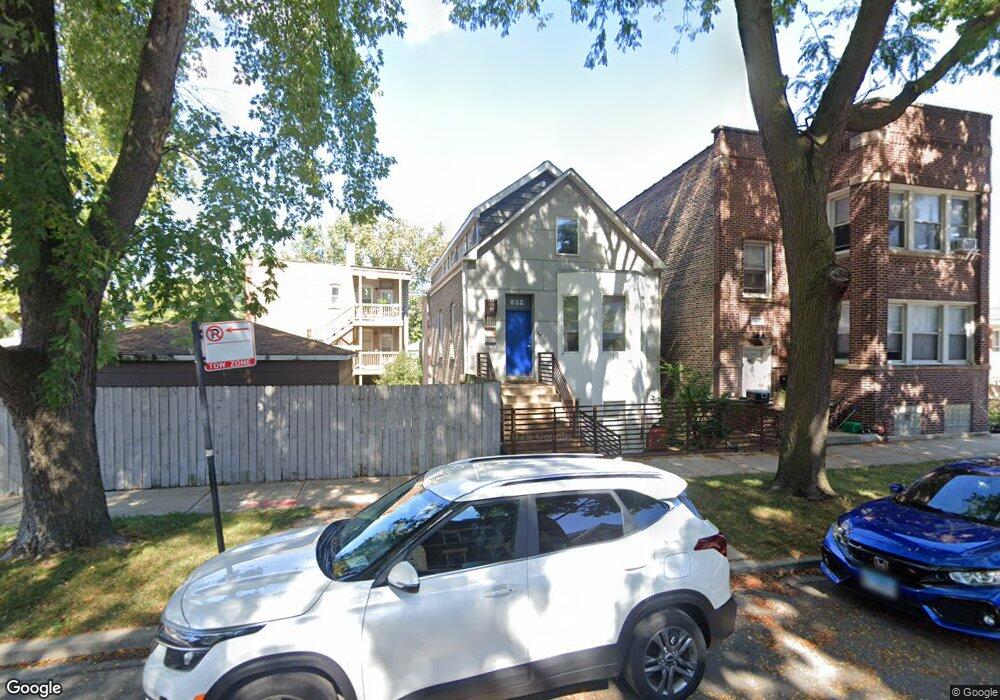
832 W 35th Place Chicago, IL 60609
Bridgeport NeighborhoodEstimated Value: $574,000 - $683,000
4
Beds
4
Baths
2,680
Sq Ft
$232/Sq Ft
Est. Value
About This Home
This home is located at 832 W 35th Place, Chicago, IL 60609 and is currently estimated at $621,343, approximately $231 per square foot. 832 W 35th Place is a home located in Cook County with nearby schools including McClellan Elementary School, Bridgeport Catholic Academy - South Campus, and De La Salle Institute - Lourdes Hall Campus.
Ownership History
Date
Name
Owned For
Owner Type
Purchase Details
Closed on
Apr 17, 2024
Sold by
832 W 35Th Pl Llc
Bought by
Ravenstein Eric David and Plessow Nadine
Current Estimated Value
Home Financials for this Owner
Home Financials are based on the most recent Mortgage that was taken out on this home.
Original Mortgage
$294,000
Outstanding Balance
$289,607
Interest Rate
6.88%
Mortgage Type
New Conventional
Estimated Equity
$331,736
Purchase Details
Closed on
Jul 11, 2006
Sold by
Bush Nancy M
Bought by
832 W 35Th Pl Llc
Purchase Details
Closed on
Jul 3, 2006
Sold by
Johnston Rachel M
Bought by
Bush Nancy M
Purchase Details
Closed on
Oct 11, 2005
Sold by
Ramdhanie Jairam and Ramdhanie Debra A
Bought by
Johnston Rachel M
Home Financials for this Owner
Home Financials are based on the most recent Mortgage that was taken out on this home.
Original Mortgage
$224,000
Interest Rate
5.89%
Mortgage Type
Fannie Mae Freddie Mac
Create a Home Valuation Report for This Property
The Home Valuation Report is an in-depth analysis detailing your home's value as well as a comparison with similar homes in the area
Home Values in the Area
Average Home Value in this Area
Purchase History
| Date | Buyer | Sale Price | Title Company |
|---|---|---|---|
| Ravenstein Eric David | $498,500 | First American Title | |
| 832 W 35Th Pl Llc | -- | Ct | |
| Bush Nancy M | $307,000 | Ct | |
| Johnston Rachel M | $280,000 | First American Title |
Source: Public Records
Mortgage History
| Date | Status | Borrower | Loan Amount |
|---|---|---|---|
| Open | Ravenstein Eric David | $294,000 | |
| Previous Owner | Johnston Rachel M | $224,000 |
Source: Public Records
Tax History Compared to Growth
Tax History
| Year | Tax Paid | Tax Assessment Tax Assessment Total Assessment is a certain percentage of the fair market value that is determined by local assessors to be the total taxable value of land and additions on the property. | Land | Improvement |
|---|---|---|---|---|
| 2024 | $6,963 | $38,000 | $18,191 | $19,809 |
| 2023 | $6,788 | $33,000 | $14,700 | $18,300 |
| 2022 | $6,788 | $33,000 | $14,700 | $18,300 |
| 2021 | $6,636 | $33,000 | $14,700 | $18,300 |
| 2020 | $6,986 | $31,359 | $11,760 | $19,599 |
| 2019 | $7,001 | $34,844 | $11,760 | $23,084 |
| 2018 | $6,883 | $34,844 | $11,760 | $23,084 |
| 2017 | $5,045 | $23,434 | $9,187 | $14,247 |
| 2016 | $4,694 | $23,434 | $9,187 | $14,247 |
| 2015 | $4,294 | $23,434 | $9,187 | $14,247 |
| 2014 | $4,190 | $22,584 | $7,350 | $15,234 |
| 2013 | $4,107 | $22,584 | $7,350 | $15,234 |
Source: Public Records
Map
Nearby Homes
- 835 W 35th St
- 3450 S Halsted St Unit 406
- 3450 S Halsted St Unit 416
- 3600 S Halsted St
- 3500 S Sangamon St Unit 214
- 917 W 34th Place
- 974 W 35th Place Unit 503
- 3600 S Union Ave
- 3505 S Morgan St Unit P77
- 3505 S Morgan St Unit 411
- 3505 S Morgan St Unit P75
- 3505 S Morgan St Unit P66
- 3533 S Union Ave
- 3416 S Union Ave
- 3357 S Emerald Ave
- 3708 S Emerald Ave
- 3405 S Union Ave
- 932 W 34th St
- 3549 S Lowe Ave
- 929 W 33rd Place
- 830 W 35th Place
- 830 W 35th Place
- 3517 S Lituanica Ave Unit 1
- 834 W 35th Place
- 828 &830 W 35th Place
- 826 W 35th Place
- 822 W 35th Place
- 3515 S Lituanica Ave Unit 1
- 3515 S Lituanica Ave
- 820 W 35th Place
- 820 W 35th Place
- 3524 S Lituanica Ave
- 3526 S Lituanica Ave
- 3522 S Lituanica Ave
- 3528 S Lituanica Ave
- 3520 S Lituanica Ave
- 3530 S Lituanica Ave
- 818 W 35th Place
- 818 W 35th Place
- 906 W 35th Place