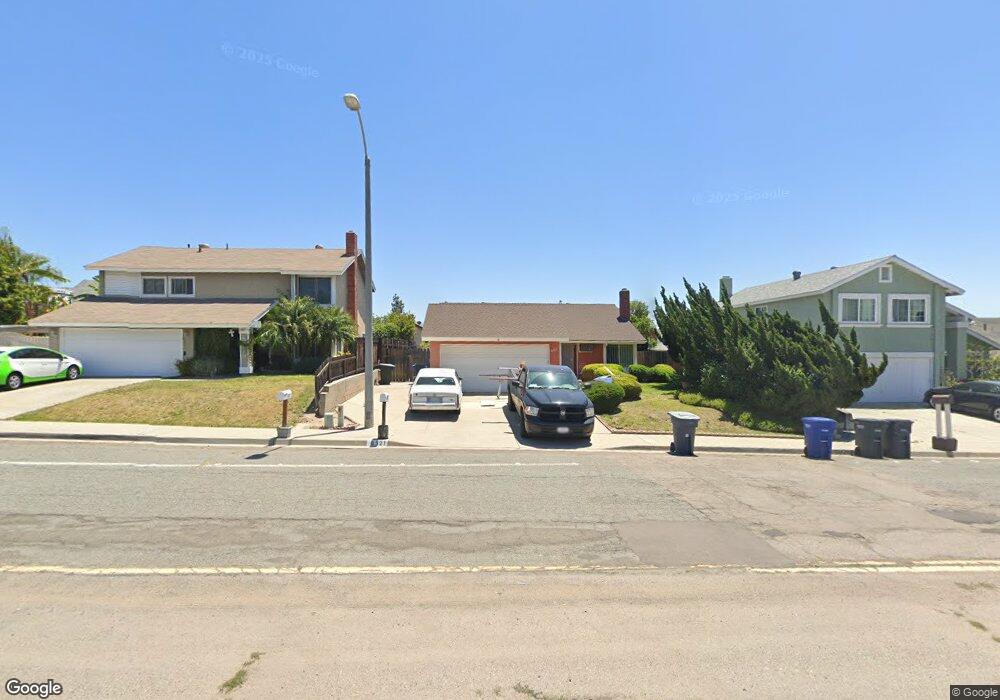
8321 Ildica St Lemon Grove, CA 91945
Estimated Value: $702,000 - $779,000
4
Beds
2
Baths
1,406
Sq Ft
$522/Sq Ft
Est. Value
About This Home
This home is located at 8321 Ildica St, Lemon Grove, CA 91945 and is currently estimated at $733,951, approximately $522 per square foot. 8321 Ildica St is a home located in San Diego County with nearby schools including Mount Miguel High School and Lighthouse Christian Academy.
Ownership History
Date
Name
Owned For
Owner Type
Purchase Details
Closed on
Mar 23, 2018
Sold by
Sellers Clarence and Sellers Clarence
Bought by
Sellers Clarence and Sellers Jacqueline
Current Estimated Value
Home Financials for this Owner
Home Financials are based on the most recent Mortgage that was taken out on this home.
Original Mortgage
$490,000
Outstanding Balance
$419,891
Interest Rate
4.38%
Mortgage Type
VA
Estimated Equity
$314,060
Purchase Details
Closed on
Mar 12, 2003
Sold by
Sellers Clarence
Bought by
Sellers Clarence
Home Financials for this Owner
Home Financials are based on the most recent Mortgage that was taken out on this home.
Original Mortgage
$252,000
Interest Rate
7.85%
Purchase Details
Closed on
Jun 26, 1998
Sold by
Sellers Glenda Faye
Bought by
Sellers Clarence
Purchase Details
Closed on
Jun 9, 1998
Sold by
Bradley Laurence D and Bradley Mary N
Bought by
Sellers Clarence
Purchase Details
Closed on
Aug 24, 1990
Create a Home Valuation Report for This Property
The Home Valuation Report is an in-depth analysis detailing your home's value as well as a comparison with similar homes in the area
Home Values in the Area
Average Home Value in this Area
Purchase History
| Date | Buyer | Sale Price | Title Company |
|---|---|---|---|
| Sellers Clarence | -- | Fidelity National Title Comp | |
| Sellers Clarence | -- | Fidelity National Title Co | |
| Sellers Clarence | -- | Commonwealth Land Title Co | |
| Sellers Clarence | $146,500 | Commonwealth Land Title Co | |
| -- | $140,000 | -- |
Source: Public Records
Mortgage History
| Date | Status | Borrower | Loan Amount |
|---|---|---|---|
| Open | Sellers Clarence | $490,000 | |
| Closed | Sellers Clarence | $252,000 |
Source: Public Records
Tax History
| Year | Tax Paid | Tax Assessment Tax Assessment Total Assessment is a certain percentage of the fair market value that is determined by local assessors to be the total taxable value of land and additions on the property. | Land | Improvement |
|---|---|---|---|---|
| 2025 | $1,365 | $229,644 | $90,086 | $139,558 |
| 2024 | $1,365 | $225,142 | $88,320 | $136,822 |
| 2023 | $2,987 | $220,729 | $86,589 | $134,140 |
| 2022 | $3,828 | $216,402 | $84,892 | $131,510 |
| 2021 | $3,060 | $212,160 | $83,228 | $128,932 |
| 2020 | $3,068 | $209,985 | $82,375 | $127,610 |
| 2019 | $3,040 | $205,868 | $80,760 | $125,108 |
| 2018 | $3,029 | $201,832 | $79,177 | $122,655 |
| 2017 | $150 | $197,875 | $77,625 | $120,250 |
| 2016 | $1,398 | $193,996 | $76,103 | $117,893 |
| 2015 | $1,383 | $191,083 | $74,960 | $116,123 |
| 2014 | $2,733 | $187,341 | $73,492 | $113,849 |
Source: Public Records
Map
Nearby Homes
- 8301 Blossom Hill Dr
- 2038 Siegle Dr
- 8409 Elkhorn St
- 1670 Enfield St
- 1654 Walbollen St
- 1547 Folkestone St
- 2217 Lyndine St
- 1742 Drexel Dr
- 8154 Golden Ave
- 1815 Sweetwater Rd Unit 37
- 1815 Sweetwater Rd Unit SPC 121
- 8055 Haven Dr
- 1265 Darby St
- 2317 Sherwood Dr
- 2515 Sweetwater Rd Unit SPC 23
- 2515 Sweetwater Rd Unit 63
- 2515 Sweetwater Rd Unit 32
- 2515 Sweetwater Rd Unit 72
- 8540 Vista Azul
- 8655 Valencia St
- 8313 Ildica St
- 1933 Siegle Dr
- 1939 Siegle Dr
- 1942 El Verde Ct
- 1957 Siegle Dr
- 1963 Siegle Dr
- 1950 El Verde Ct
- 1927 Siegle Dr
- 1945 Siegle Dr
- 8325 Blossom Hill Dr
- 8317 Blossom Hill Dr
- 8333 Blossom Hill Dr
- 8309 Blossom Hill Dr
- 1934 El Verde Ct
- 1921 Siegle Dr
- 8341 Blossom Hill Dr
- 1932 Siegle Dr
- 8349 Blossom Hill Dr
- 1915 Siegle Dr
- 1933 El Verde Ct
Your Personal Tour Guide
Ask me questions while you tour the home.