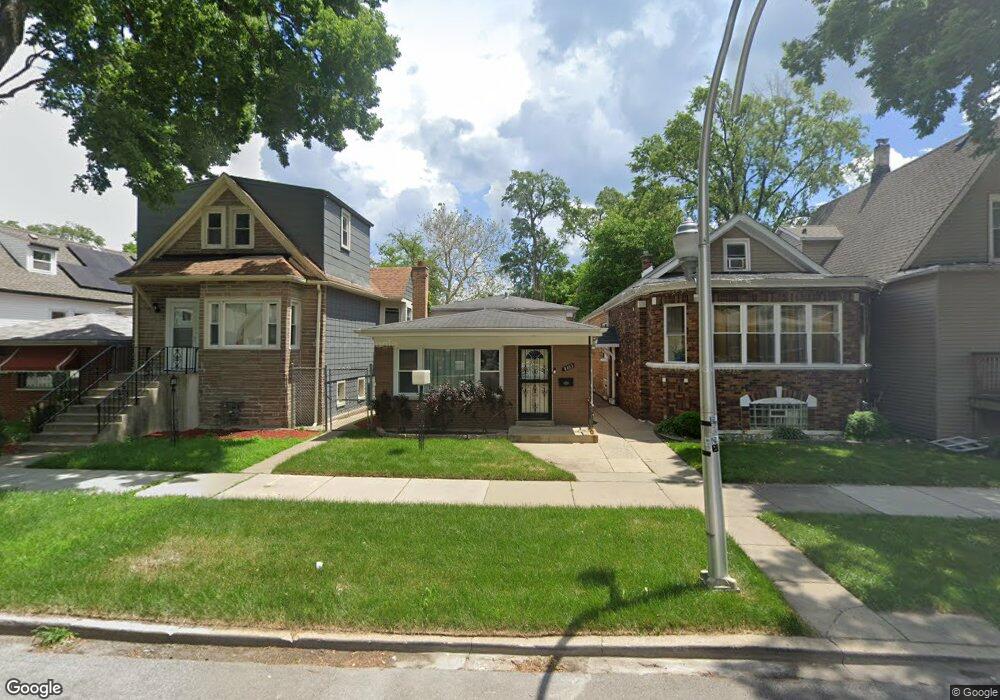
8323 S Constance Ave Chicago, IL 60617
Calumet Heights NeighborhoodEstimated Value: $160,000 - $214,000
3
Beds
2
Baths
1,056
Sq Ft
$182/Sq Ft
Est. Value
About This Home
This home is located at 8323 S Constance Ave, Chicago, IL 60617 and is currently estimated at $191,717, approximately $181 per square foot. 8323 S Constance Ave is a home located in Cook County with nearby schools including Caldwell Elementary Academy and CICS Avalon.
Ownership History
Date
Name
Owned For
Owner Type
Purchase Details
Closed on
May 10, 1999
Sold by
Bankers Trust Company
Bought by
Duncan Heather
Current Estimated Value
Home Financials for this Owner
Home Financials are based on the most recent Mortgage that was taken out on this home.
Original Mortgage
$87,403
Outstanding Balance
$21,008
Interest Rate
6.92%
Mortgage Type
FHA
Estimated Equity
$170,709
Purchase Details
Closed on
Aug 14, 1998
Sold by
Washington James W and Washington Renia
Bought by
Bankers Trust Company
Purchase Details
Closed on
Apr 26, 1994
Sold by
Washington James
Bought by
Washington James and Washington Renia
Home Financials for this Owner
Home Financials are based on the most recent Mortgage that was taken out on this home.
Original Mortgage
$64,400
Interest Rate
8.08%
Purchase Details
Closed on
Nov 30, 1993
Sold by
Lasalle National Trust Na
Bought by
Washington Marie
Purchase Details
Closed on
Nov 12, 1993
Sold by
Chatman Cora
Bought by
Washington James
Purchase Details
Closed on
Oct 20, 1993
Sold by
Chatman Cynthia
Bought by
Washington James W
Create a Home Valuation Report for This Property
The Home Valuation Report is an in-depth analysis detailing your home's value as well as a comparison with similar homes in the area
Home Values in the Area
Average Home Value in this Area
Purchase History
| Date | Buyer | Sale Price | Title Company |
|---|---|---|---|
| Duncan Heather | $88,000 | -- | |
| Bankers Trust Company | -- | -- | |
| Washington James | -- | Ticor Title | |
| Washington Marie | -- | Equity Title | |
| Washington James | -- | Equity Title | |
| Washington James | -- | Equity Title | |
| Washington James W | -- | Equity Title | |
| Washington James W | -- | -- | |
| Washington James W | -- | Equity Title | |
| Washington James W | -- | Equity Title | |
| Washington James | -- | Equity Title |
Source: Public Records
Mortgage History
| Date | Status | Borrower | Loan Amount |
|---|---|---|---|
| Open | Duncan Heather | $87,403 | |
| Previous Owner | Washington James | $64,400 |
Source: Public Records
Tax History
| Year | Tax Paid | Tax Assessment Tax Assessment Total Assessment is a certain percentage of the fair market value that is determined by local assessors to be the total taxable value of land and additions on the property. | Land | Improvement |
|---|---|---|---|---|
| 2025 | $1,410 | $12,401 | $2,363 | $10,038 |
| 2024 | $1,410 | $12,401 | $2,363 | $10,038 |
| 2023 | $1,353 | $10,001 | $3,938 | $6,063 |
| 2022 | $1,353 | $10,001 | $3,938 | $6,063 |
| 2021 | $1,341 | $9,999 | $3,937 | $6,062 |
| 2020 | $1,828 | $11,309 | $2,835 | $8,474 |
| 2019 | $1,836 | $12,566 | $2,835 | $9,731 |
| 2018 | $1,804 | $12,566 | $2,835 | $9,731 |
| 2017 | $2,075 | $13,016 | $2,520 | $10,496 |
| 2016 | $2,107 | $13,016 | $2,520 | $10,496 |
| 2015 | $2,198 | $14,619 | $2,520 | $12,099 |
| 2014 | $1,989 | $13,290 | $2,205 | $11,085 |
| 2013 | $1,939 | $13,290 | $2,205 | $11,085 |
Source: Public Records
Map
Nearby Homes
- 8325 S Cregier Ave
- 8351 S Cregier Ave
- 8239 S Ridgeland Ave
- 1730 E 83rd Place
- 1727 E 83rd Place
- 8151 S Bennett Ave
- 1711 E 83rd St
- 8145 S Euclid Ave
- 8114 S Anthony Ave
- 8110 S Chappel Ave
- 8129 S Cornell Ave
- 8030 S Constance Ave
- 8207 S Clyde Ave
- 8314 S Stony Island Ave
- 8344 S Stony Island Ave
- 8550 S Jeffery Blvd
- 8249 S Harper Ave
- 8103 S Clyde Ave
- 8044 S Clyde Ave
- 8623 S Cregier Ave
- 8321 S Constance Ave
- 8325 S Constance Ave
- 8319 S Constance Ave
- 8327 S Constance Ave
- 8329 S Constance Ave
- 8331 S Constance Ave
- 8313 S Constance Ave
- 8335 S Constance Ave
- 8311 S Constance Ave
- 8322 S Bennett Ave
- 8324 S Bennett Ave
- 8328 S Bennett Ave
- 8339 S Constance Ave
- 8316 S Bennett Ave
- 8307 S Constance Ave
- 8330 S Bennett Ave
- 8312 S Bennett Ave
- 8341 S Constance Ave
- 8334 S Bennett Ave
- 8310 S Bennett Ave
Your Personal Tour Guide
Ask me questions while you tour the home.