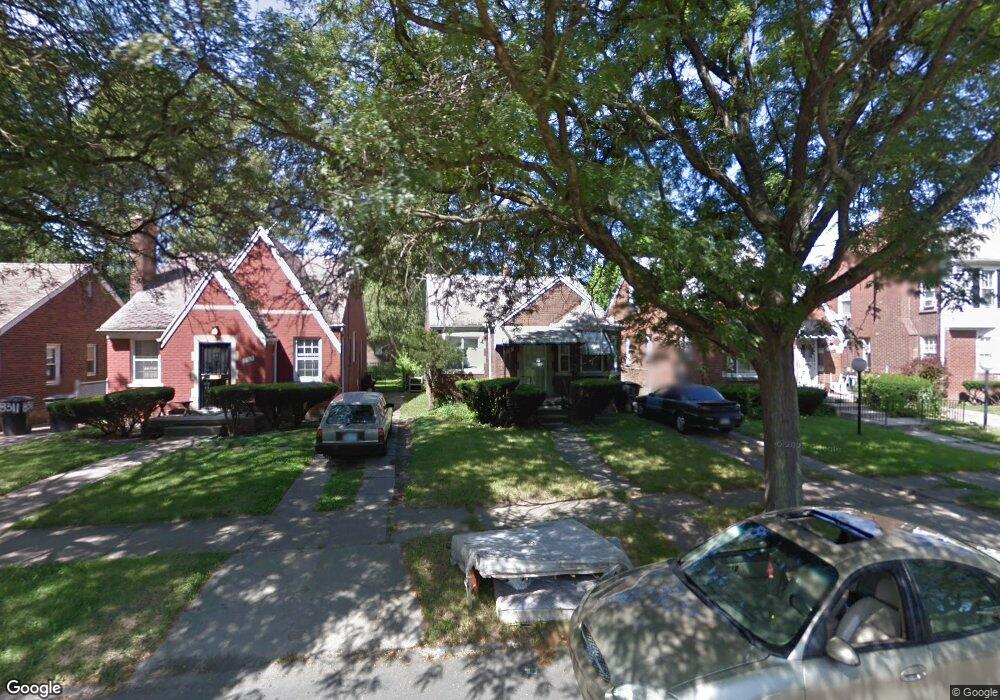
8325 Coyle St Detroit, MI 48228
Fiskhorn NeighborhoodEstimated Value: $67,000 - $88,000
--
Bed
1
Bath
801
Sq Ft
$99/Sq Ft
Est. Value
About This Home
This home is located at 8325 Coyle St, Detroit, MI 48228 and is currently estimated at $78,973, approximately $98 per square foot. 8325 Coyle St is a home located in Wayne County with nearby schools including Barton Elementary School, Charles L. Spain Elementary-Middle School, and Edward 'Duke' Ellington Conservatory of Music and Art.
Ownership History
Date
Name
Owned For
Owner Type
Purchase Details
Closed on
Nov 14, 2019
Sold by
Guratiba Investments Llc
Bought by
Rbf Trust Llc
Current Estimated Value
Purchase Details
Closed on
Aug 29, 2019
Sold by
Rbf Trust Llc
Bought by
Manouchka Consulting Llc
Purchase Details
Closed on
Oct 10, 2018
Sold by
Unique Home Rentals Llc
Bought by
Cedar Key Llc
Purchase Details
Closed on
Oct 9, 2018
Sold by
Hagerman Stephen
Bought by
Unique Home Rentals Llc
Purchase Details
Closed on
Nov 21, 2014
Sold by
Wayne County Treasurer
Bought by
Hagerman Stephen and Unique Home Rentals Llc
Purchase Details
Closed on
Nov 18, 2011
Sold by
Wojtowicz Raymond J
Bought by
Jenkins Eric
Purchase Details
Closed on
Nov 2, 2006
Sold by
Knight John
Bought by
Homecomings Financial
Purchase Details
Closed on
Jul 31, 2003
Sold by
Caja Developments Llp
Bought by
Knight John
Create a Home Valuation Report for This Property
The Home Valuation Report is an in-depth analysis detailing your home's value as well as a comparison with similar homes in the area
Home Values in the Area
Average Home Value in this Area
Purchase History
| Date | Buyer | Sale Price | Title Company |
|---|---|---|---|
| Rbf Trust Llc | $500 | None Available | |
| Manouchka Consulting Llc | $500 | None Available | |
| Cedar Key Llc | $265,500 | Leading Edge Title Agency | |
| Unique Home Rentals Llc | -- | Leading Edge Title Agency | |
| Hagerman Stephen | $2,730 | None Available | |
| Jenkins Eric | $3,200 | None Available | |
| Homecomings Financial | -- | None Available | |
| Knight John | $74,000 | Lamont Title Corporation |
Source: Public Records
Tax History Compared to Growth
Tax History
| Year | Tax Paid | Tax Assessment Tax Assessment Total Assessment is a certain percentage of the fair market value that is determined by local assessors to be the total taxable value of land and additions on the property. | Land | Improvement |
|---|---|---|---|---|
| 2025 | $1,012 | $27,500 | $0 | $0 |
| 2024 | $1,012 | $22,500 | $0 | $0 |
| 2023 | $982 | $18,600 | $0 | $0 |
| 2022 | $1,042 | $14,600 | $0 | $0 |
| 2021 | $1,016 | $12,300 | $0 | $0 |
| 2020 | $1,015 | $11,200 | $0 | $0 |
| 2019 | $1,001 | $8,600 | $0 | $0 |
| 2018 | $692 | $8,000 | $0 | $0 |
| 2017 | $109 | $7,200 | $0 | $0 |
| 2016 | $747 | $11,100 | $0 | $0 |
| 2015 | $1,110 | $11,100 | $0 | $0 |
| 2013 | $1,566 | $15,655 | $0 | $0 |
| 2010 | -- | $22,431 | $814 | $21,617 |
Source: Public Records
Map
Nearby Homes