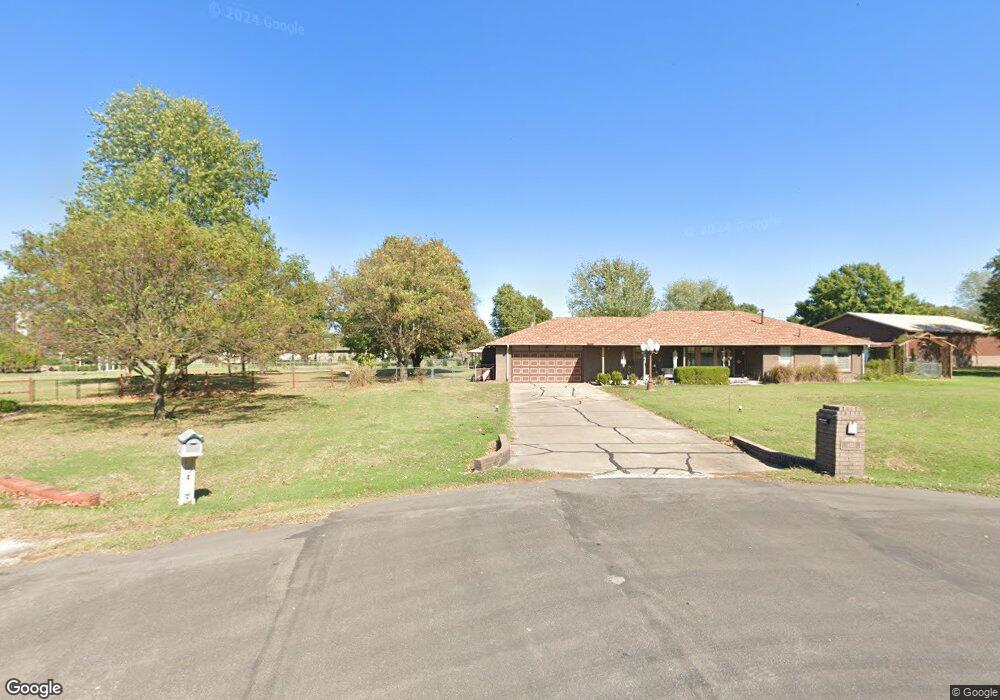
8325 N 159th East Ave Owasso, OK 74055
Estimated Value: $372,000 - $400,000
3
Beds
3
Baths
2,188
Sq Ft
$175/Sq Ft
Est. Value
About This Home
This home is located at 8325 N 159th East Ave, Owasso, OK 74055 and is currently estimated at $383,811, approximately $175 per square foot. 8325 N 159th East Ave is a home located in Rogers County with nearby schools including Pamela Hodson Elementary School, Owasso 6th Grade Center, and Owasso 8th Grade Center.
Ownership History
Date
Name
Owned For
Owner Type
Purchase Details
Closed on
Jan 23, 2025
Sold by
Laursen John E
Bought by
John Einar Laursen Revocable Living Trust
Current Estimated Value
Purchase Details
Closed on
Apr 11, 2011
Sold by
Lovelace Rick A and Lovelace Merry M
Bought by
Laursen John E and Laursen Beverly
Home Financials for this Owner
Home Financials are based on the most recent Mortgage that was taken out on this home.
Original Mortgage
$166,250
Interest Rate
4.92%
Mortgage Type
New Conventional
Purchase Details
Closed on
Sep 28, 2006
Sold by
Blevins William J and Blevins Sandra K
Bought by
Lovelace Rick A
Home Financials for this Owner
Home Financials are based on the most recent Mortgage that was taken out on this home.
Original Mortgage
$125,000
Interest Rate
6.47%
Mortgage Type
New Conventional
Create a Home Valuation Report for This Property
The Home Valuation Report is an in-depth analysis detailing your home's value as well as a comparison with similar homes in the area
Home Values in the Area
Average Home Value in this Area
Purchase History
| Date | Buyer | Sale Price | Title Company |
|---|---|---|---|
| John Einar Laursen Revocable Living Trust | -- | None Listed On Document | |
| Laursen John E | $175,000 | None Available | |
| Lovelace Rick A | $175,000 | None Available |
Source: Public Records
Mortgage History
| Date | Status | Borrower | Loan Amount |
|---|---|---|---|
| Previous Owner | Laursen John E | $166,250 | |
| Previous Owner | Lovelace Rick A | $125,000 |
Source: Public Records
Tax History Compared to Growth
Tax History
| Year | Tax Paid | Tax Assessment Tax Assessment Total Assessment is a certain percentage of the fair market value that is determined by local assessors to be the total taxable value of land and additions on the property. | Land | Improvement |
|---|---|---|---|---|
| 2024 | $2,894 | $30,127 | $7,567 | $22,560 |
| 2023 | $2,894 | $28,693 | $4,646 | $24,047 |
| 2022 | $2,677 | $27,326 | $3,300 | $24,026 |
| 2021 | $2,553 | $26,386 | $3,300 | $23,086 |
| 2020 | $2,541 | $26,389 | $3,300 | $23,089 |
| 2019 | $2,422 | $25,056 | $3,300 | $21,756 |
| 2018 | $2,446 | $26,280 | $3,300 | $22,980 |
| 2017 | $2,439 | $25,934 | $3,300 | $22,634 |
| 2016 | $2,389 | $25,372 | $3,300 | $22,072 |
| 2015 | $2,366 | $24,715 | $3,300 | $21,415 |
| 2014 | $2,355 | $24,604 | $3,300 | $21,304 |
Source: Public Records
Map
Nearby Homes
- 15301 E 83rd St N
- 15511 E 87th St N
- 15919 E 79th St N
- 8104 N 154th East Ave
- 8221 N 166th East Ave
- 15336 E 89th Ct N
- 15008 E 88th St N
- 15412 E 78th St N
- 15337 E 89th Ct N
- 15818 E 77th St N
- 15848 E 77th St N
- 15310 E 89th Place N
- 14910 E 83rd St N
- 15911 E 75th Place N
- 15907 E 75th Place N
- 15903 E 75th Place N
- 15915 E 75th Place N
- 15919 E 75th Place N
- 15803 E 75th Place N
- 15927 E 75th Place N
- 8324 N 159th East Ave
- 8324 N 159th East Ave
- 8313 N 159th East Ave
- 8313 N 159th Ave E
- 8307 N 159th East Ct
- 8306 N 159th East Ct
- 8310 N 160th East Ct
- 8304 N 159th East Ave
- 8321 N 158th East Ave
- 8301 N 160th East Ct
- 8332 N 161st Ave E
- 8308 N 159th East Ave
- 8322 N 161st Ave E
- 8305 N 158th East Ave
- 16005 E 83rd St N
- 8312 N 159th East Ct
- 8319 N 159th East Ct
- 8312 N 161st East Ave
- 10734 N 158th East Ave
- 15401 E 82nd St N