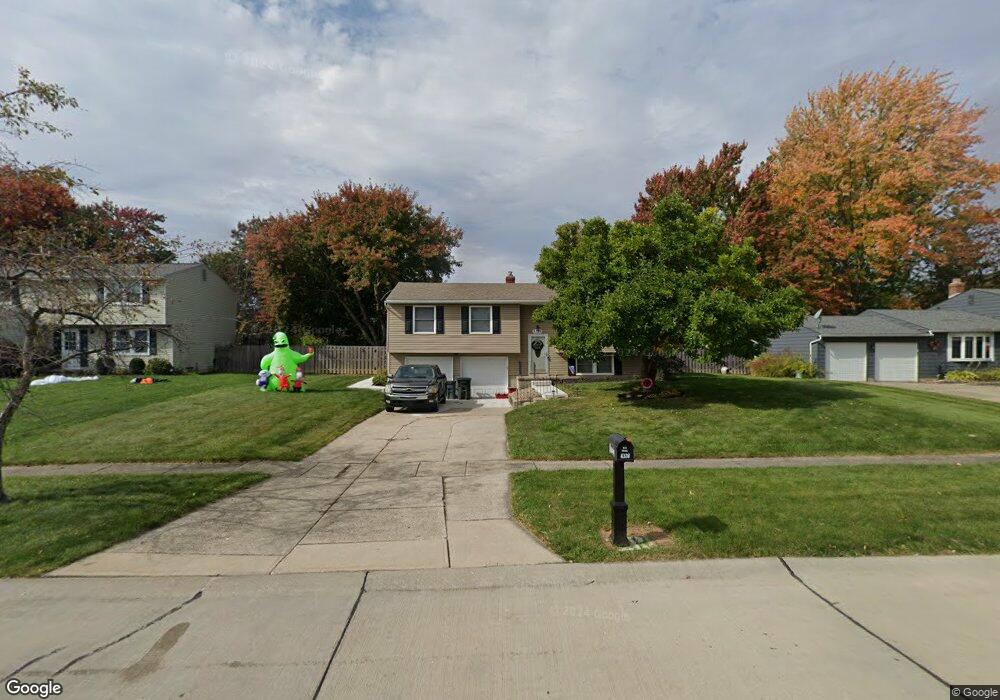
8328 Celianna Dr Strongsville, OH 44149
Estimated Value: $285,382 - $336,000
3
Beds
2
Baths
1,560
Sq Ft
$196/Sq Ft
Est. Value
About This Home
This home is located at 8328 Celianna Dr, Strongsville, OH 44149 and is currently estimated at $305,596, approximately $195 per square foot. 8328 Celianna Dr is a home located in Cuyahoga County with nearby schools including Strongsville High School, St Mary School, and Sts Joseph & John Interparochial School.
Ownership History
Date
Name
Owned For
Owner Type
Purchase Details
Closed on
Jul 2, 2013
Sold by
Robindale Associates Llc
Bought by
Damalas Kelly
Current Estimated Value
Home Financials for this Owner
Home Financials are based on the most recent Mortgage that was taken out on this home.
Original Mortgage
$140,409
Outstanding Balance
$100,791
Interest Rate
3.62%
Mortgage Type
FHA
Estimated Equity
$204,805
Purchase Details
Closed on
Sep 28, 2012
Sold by
Sass James A
Bought by
Robindale Associates Llc
Purchase Details
Closed on
Jul 3, 2012
Sold by
Sass Bruce Wayne and Sass Diane
Bought by
Sass James A
Purchase Details
Closed on
May 8, 2012
Sold by
Sass James A
Bought by
Sass Bruce Wayne and Sass Lynette Jean
Purchase Details
Closed on
Oct 16, 1979
Sold by
Sass James A and Sass Margaret J
Bought by
Sass James A
Purchase Details
Closed on
Jan 1, 1975
Bought by
Sass James A and Sass Margaret J
Create a Home Valuation Report for This Property
The Home Valuation Report is an in-depth analysis detailing your home's value as well as a comparison with similar homes in the area
Home Values in the Area
Average Home Value in this Area
Purchase History
| Date | Buyer | Sale Price | Title Company |
|---|---|---|---|
| Damalas Kelly | $144,000 | First American Title Ins Co | |
| Robindale Associates Llc | $75,000 | First American Title Ins Co | |
| Sass James A | -- | None Available | |
| Sass Bruce Wayne | -- | Public | |
| Sass James A | -- | -- | |
| Sass James A | -- | -- |
Source: Public Records
Mortgage History
| Date | Status | Borrower | Loan Amount |
|---|---|---|---|
| Open | Damalas Kelly | $140,409 |
Source: Public Records
Tax History Compared to Growth
Tax History
| Year | Tax Paid | Tax Assessment Tax Assessment Total Assessment is a certain percentage of the fair market value that is determined by local assessors to be the total taxable value of land and additions on the property. | Land | Improvement |
|---|---|---|---|---|
| 2024 | $3,758 | $80,045 | $19,145 | $60,900 |
| 2023 | $3,932 | $62,790 | $16,170 | $46,620 |
| 2022 | $3,903 | $62,790 | $16,170 | $46,620 |
| 2021 | $3,872 | $62,790 | $16,170 | $46,620 |
| 2020 | $3,589 | $51,490 | $13,270 | $38,220 |
| 2019 | $3,484 | $147,100 | $37,900 | $109,200 |
| 2018 | $3,140 | $51,490 | $13,270 | $38,220 |
| 2017 | $3,176 | $47,880 | $10,990 | $36,890 |
| 2016 | $3,150 | $47,880 | $10,990 | $36,890 |
| 2015 | $2,889 | $47,880 | $10,990 | $36,890 |
| 2014 | $2,889 | $43,300 | $10,680 | $32,620 |
Source: Public Records
Map
Nearby Homes
- 8902 Lincolnshire Blvd
- 8036 Fair Rd
- 8746 Barton Dr
- 458 Sprague Rd
- 8627 Courtland Dr
- 9598 Pebble Brook Ln
- 9384 N Marks Rd
- 243 Jananna Dr
- 740 Fair St
- 23004 Chandlers Ln Unit 109
- 9829 Plum Brook Ln
- 23003 Chandlers Ln Unit 230
- 8896 Firethorne Dr
- 9797 Sugarbush Cir
- 84 Sprague Rd
- 647 Tampico Ct Unit 7
- 648 Tampico Ct Unit 37
- 148 Meadow Cir
- 104 Whitehall Dr
- 23002 Chandlers Ln
- 8324 Celianna Dr
- 8334 Celianna Dr
- 8335 Bernice Dr
- 8333 Bernice Dr
- 8320 Celianna Dr
- 8338 Celianna Dr
- 8349 Bernice Dr
- 8327 Bernice Dr
- 8345 Celianna Dr
- 8365 Celianna Dr
- 8361 Bernice Dr
- 8342 Celianna Dr
- 8316 Celianna Dr
- 8337 Celianna Dr
- 8319 Bernice Dr
- 8369 Celianna Dr
- 8371 Bernice Dr
- 8325 Celianna Dr
- 8381 Celianna Dr
- 8312 Celianna Dr