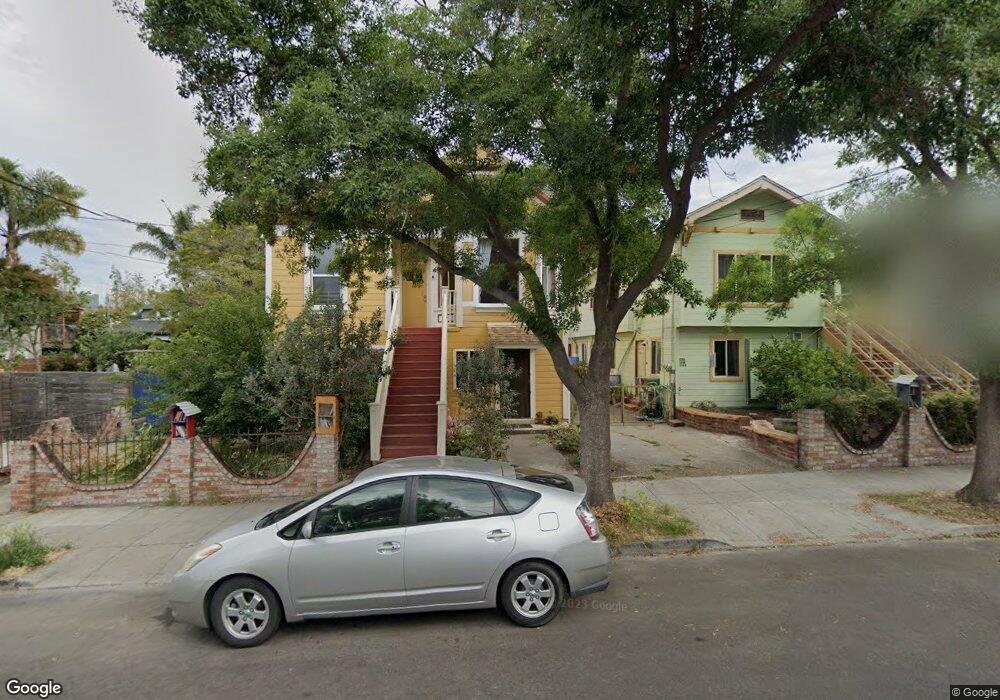
832A 59th St Unit 832A Emeryville, CA 94608
Santa Fe NeighborhoodEstimated Value: $649,000 - $999,000
2
Beds
2
Baths
972
Sq Ft
$875/Sq Ft
Est. Value
About This Home
This home is located at 832A 59th St Unit 832A, Emeryville, CA 94608 and is currently estimated at $850,293, approximately $874 per square foot. 832A 59th St Unit 832A is a home located in Alameda County with nearby schools including Sankofa United Elementary School, Claremont Middle School, and Oakland Technical High School.
Ownership History
Date
Name
Owned For
Owner Type
Purchase Details
Closed on
Jul 21, 2008
Sold by
Mariposa Grove Clt Homes Llc
Bought by
Huet Timothy M and Marshall Kirsten H
Current Estimated Value
Home Financials for this Owner
Home Financials are based on the most recent Mortgage that was taken out on this home.
Original Mortgage
$8,785
Interest Rate
6.49%
Mortgage Type
Stand Alone Second
Create a Home Valuation Report for This Property
The Home Valuation Report is an in-depth analysis detailing your home's value as well as a comparison with similar homes in the area
Home Values in the Area
Average Home Value in this Area
Purchase History
| Date | Buyer | Sale Price | Title Company |
|---|---|---|---|
| Huet Timothy M | $293,000 | Old Republic Title Company |
Source: Public Records
Mortgage History
| Date | Status | Borrower | Loan Amount |
|---|---|---|---|
| Previous Owner | Huet Timothy M | $8,785 |
Source: Public Records
Tax History Compared to Growth
Tax History
| Year | Tax Paid | Tax Assessment Tax Assessment Total Assessment is a certain percentage of the fair market value that is determined by local assessors to be the total taxable value of land and additions on the property. | Land | Improvement |
|---|---|---|---|---|
| 2025 | $5,986 | $370,287 | $113,186 | $264,101 |
| 2024 | $5,986 | $362,891 | $110,967 | $258,924 |
| 2023 | $6,242 | $362,640 | $108,792 | $253,848 |
| 2022 | $6,031 | $348,531 | $106,659 | $248,872 |
| 2021 | $5,673 | $341,561 | $104,568 | $243,993 |
| 2020 | $5,605 | $344,988 | $103,496 | $241,492 |
| 2019 | $5,331 | $338,227 | $101,468 | $236,759 |
| 2018 | $5,212 | $331,596 | $99,479 | $232,117 |
| 2017 | $4,978 | $325,094 | $97,528 | $227,566 |
| 2016 | $4,875 | $318,721 | $95,616 | $223,105 |
| 2015 | $4,845 | $313,937 | $94,181 | $219,756 |
| 2014 | $4,974 | $307,790 | $92,337 | $215,453 |
Source: Public Records
Map
Nearby Homes