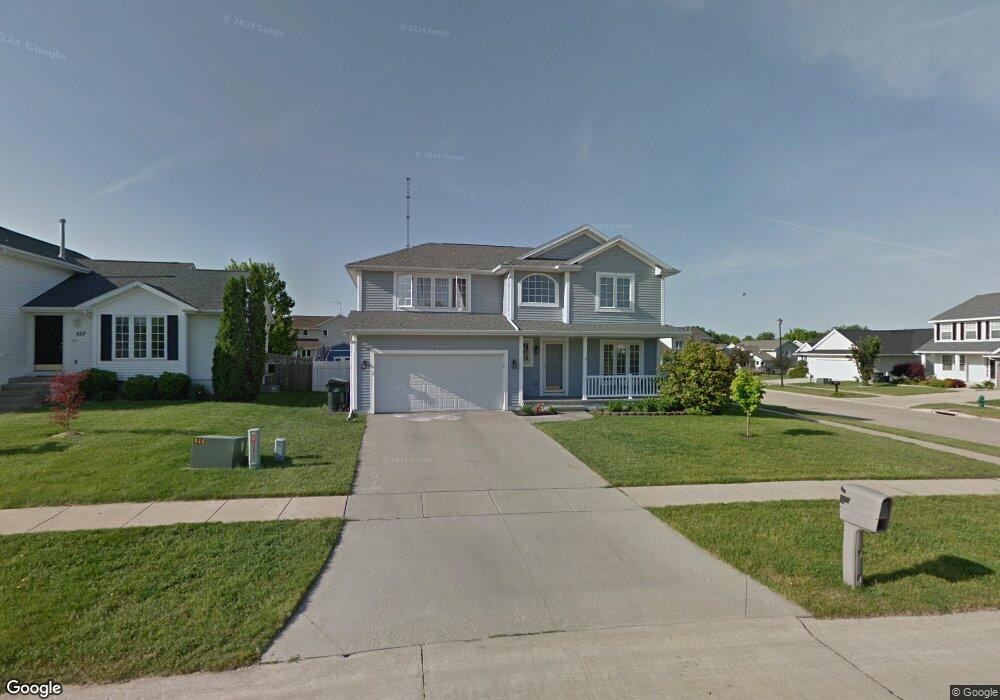
833 73rd St NE Cedar Rapids, IA 52402
Estimated Value: $301,000 - $344,000
3
Beds
3
Baths
1,907
Sq Ft
$170/Sq Ft
Est. Value
About This Home
This home is located at 833 73rd St NE, Cedar Rapids, IA 52402 and is currently estimated at $324,655, approximately $170 per square foot. 833 73rd St NE is a home located in Linn County with nearby schools including Westfield Elementary School, Oak Ridge School, and Linn-Mar High School.
Ownership History
Date
Name
Owned For
Owner Type
Purchase Details
Closed on
Jun 29, 2006
Sold by
Davis William A and Davis April
Bought by
Glau Jeffrey T and Gibbs Nicole W
Current Estimated Value
Home Financials for this Owner
Home Financials are based on the most recent Mortgage that was taken out on this home.
Original Mortgage
$148,000
Interest Rate
6.73%
Mortgage Type
Unknown
Purchase Details
Closed on
May 4, 2001
Sold by
Jerrys Homes Inc
Bought by
Davis William A and Davis April
Home Financials for this Owner
Home Financials are based on the most recent Mortgage that was taken out on this home.
Original Mortgage
$141,812
Interest Rate
7.02%
Purchase Details
Closed on
May 4, 2000
Sold by
Havlik Richard M and Havlik Alicia
Bought by
Wilkin Jeffrey D and Wilkin Debra J
Create a Home Valuation Report for This Property
The Home Valuation Report is an in-depth analysis detailing your home's value as well as a comparison with similar homes in the area
Home Values in the Area
Average Home Value in this Area
Purchase History
| Date | Buyer | Sale Price | Title Company |
|---|---|---|---|
| Glau Jeffrey T | $184,500 | None Available | |
| Davis William A | $177,000 | -- | |
| Wilkin Jeffrey D | -- | -- |
Source: Public Records
Mortgage History
| Date | Status | Borrower | Loan Amount |
|---|---|---|---|
| Previous Owner | Glau Jeffrey T | $148,000 | |
| Previous Owner | Davis William A | $141,812 |
Source: Public Records
Tax History Compared to Growth
Tax History
| Year | Tax Paid | Tax Assessment Tax Assessment Total Assessment is a certain percentage of the fair market value that is determined by local assessors to be the total taxable value of land and additions on the property. | Land | Improvement |
|---|---|---|---|---|
| 2025 | $5,682 | $321,400 | $59,100 | $262,300 |
| 2024 | $5,844 | $317,700 | $59,100 | $258,600 |
| 2023 | $5,844 | $300,500 | $55,400 | $245,100 |
| 2022 | $4,886 | $264,600 | $51,700 | $212,900 |
| 2021 | $5,058 | $229,700 | $48,000 | $181,700 |
| 2020 | $5,058 | $224,000 | $38,800 | $185,200 |
| 2019 | $4,812 | $215,700 | $38,800 | $176,900 |
| 2018 | $4,538 | $215,700 | $38,800 | $176,900 |
| 2017 | $4,450 | $202,700 | $38,800 | $163,900 |
| 2016 | $4,535 | $202,700 | $38,800 | $163,900 |
| 2015 | $4,619 | $206,241 | $29,536 | $176,705 |
| 2014 | $4,424 | $206,241 | $29,536 | $176,705 |
| 2013 | $4,272 | $206,241 | $29,536 | $176,705 |
Source: Public Records
Map
Nearby Homes
- 935 74th St NE Unit 1
- 803 73rd St NE
- 7502 Summerset Ave NE
- 1055 74th St NE Unit 1055
- 7599 Summerset Ave NE
- 7104 Doubletree Rd NE
- 7415 Pin Tail Dr NE
- 7701 Westfield Dr NE
- 6965 Doubletree Rd NE Unit 6965
- 1229 Honey Creek Way NE
- 1008 Doubletree Ct NE Unit 1008
- 1241 74th St NE Unit 1241
- 1027 Acacia Dr NE
- 7128 Summerland Ridge Rd NE
- 1226 Prairieview Dr NE
- 1215 Prairieview Dr NE
- 1127 Tiara Dr NE
- 733 Broderick Dr NE Unit B
- 929 Messina Dr NE
- 923 Messina Dr NE
- 827 73rd St NE
- 821 73rd St NE
- 832 71st St NE
- 826 71st St NE
- 820 71st St NE
- 1126 White Ivy Place NE
- 1120 White Ivy Place NE
- 815 73rd St NE
- 1114 White Ivy Place NE
- 902 71st St NE
- 814 71st St NE
- 822 73rd St NE
- 1132 White Ivy Place NE
- 809 73rd St NE
- 906 71st St NE
- 808 71st St NE
- 816 73rd St NE
- 1138 White Ivy Place NE
- 910 71st St NE
- 802 71st St NE