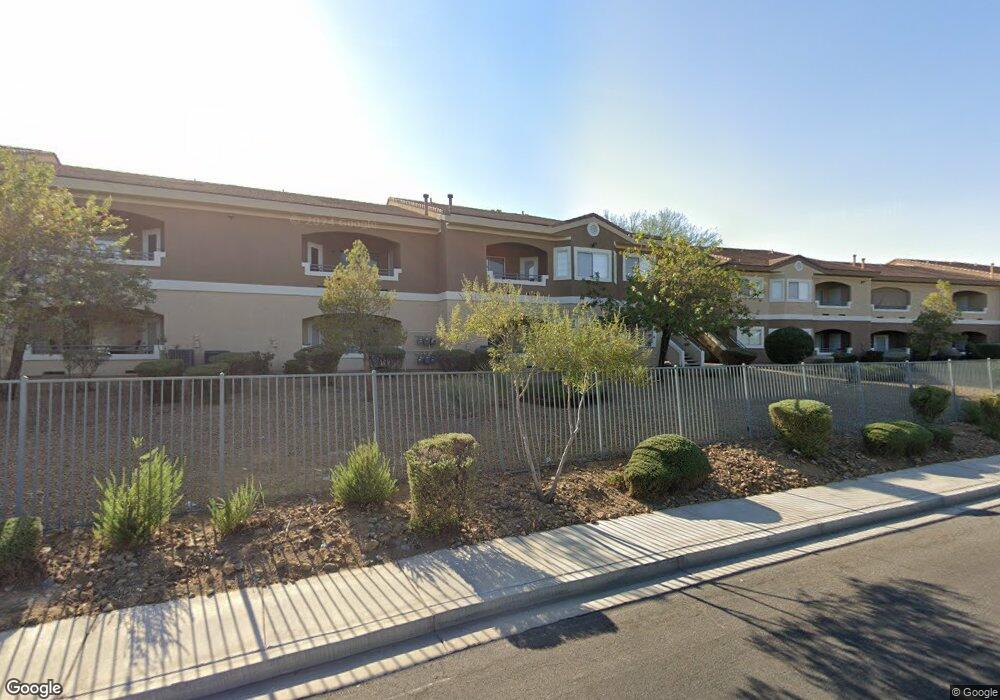
833 Aspen Peak Loop Unit 2113 Henderson, NV 89011
South Valley Ranch NeighborhoodEstimated Value: $225,827 - $245,000
2
Beds
2
Baths
1,160
Sq Ft
$202/Sq Ft
Est. Value
About This Home
This home is located at 833 Aspen Peak Loop Unit 2113, Henderson, NV 89011 and is currently estimated at $234,707, approximately $202 per square foot. 833 Aspen Peak Loop Unit 2113 is a home located in Clark County with nearby schools including Josh Stevens Elementary School, Francis H Cortney Junior High School, and Basic Academy of International Studies.
Ownership History
Date
Name
Owned For
Owner Type
Purchase Details
Closed on
Feb 5, 2010
Sold by
Deutsche Bank National Trust Company
Bought by
Reilly Joann
Current Estimated Value
Purchase Details
Closed on
Oct 12, 2009
Sold by
Bures Ron
Bought by
Deutsche Bank National Trust Company
Purchase Details
Closed on
Aug 30, 2007
Sold by
Bures Ron
Bought by
Brynwood Llc Aspen Peak 2113 Series
Purchase Details
Closed on
Oct 21, 2005
Sold by
Aspen Peak Llc
Bought by
Bures Ron
Home Financials for this Owner
Home Financials are based on the most recent Mortgage that was taken out on this home.
Original Mortgage
$130,410
Interest Rate
7.75%
Mortgage Type
Purchase Money Mortgage
Create a Home Valuation Report for This Property
The Home Valuation Report is an in-depth analysis detailing your home's value as well as a comparison with similar homes in the area
Home Values in the Area
Average Home Value in this Area
Purchase History
| Date | Buyer | Sale Price | Title Company |
|---|---|---|---|
| Reilly Joann | $61,500 | Ticor Title Las Vegas | |
| Deutsche Bank National Trust Company | $105,300 | None Available | |
| Brynwood Llc Aspen Peak 2113 Series | -- | None Available | |
| Bures Ron | $144,900 | National Title Company |
Source: Public Records
Mortgage History
| Date | Status | Borrower | Loan Amount |
|---|---|---|---|
| Previous Owner | Bures Ron | $130,410 |
Source: Public Records
Tax History Compared to Growth
Tax History
| Year | Tax Paid | Tax Assessment Tax Assessment Total Assessment is a certain percentage of the fair market value that is determined by local assessors to be the total taxable value of land and additions on the property. | Land | Improvement |
|---|---|---|---|---|
| 2025 | $730 | $60,576 | $19,950 | $40,626 |
| 2024 | $710 | $60,576 | $19,950 | $40,626 |
| 2023 | $744 | $58,249 | $21,000 | $37,249 |
| 2022 | $722 | $51,849 | $17,500 | $34,349 |
| 2021 | $669 | $50,051 | $16,800 | $33,251 |
| 2020 | $647 | $48,672 | $16,100 | $32,572 |
| 2019 | $639 | $46,289 | $14,000 | $32,289 |
| 2018 | $610 | $36,611 | $7,000 | $29,611 |
| 2017 | $869 | $29,978 | $5,250 | $24,728 |
| 2016 | $579 | $29,296 | $5,250 | $24,046 |
| 2015 | $576 | $19,288 | $4,200 | $15,088 |
| 2014 | $559 | $18,990 | $4,200 | $14,790 |
Source: Public Records
Map
Nearby Homes
- 833 Aspen Peak Loop Unit 613
- 833 Aspen Peak Loop Unit 712
- 833 Aspen Peak Loop Unit 2613
- 833 Aspen Peak Loop Unit 1021
- 833 Aspen Peak Loop Unit 1321
- 6909 Graceful Cloud Ave
- 6946 Graceful Cloud Ave
- 733 Hitchen Post Dr
- 740 Moonlight Mesa Dr
- 6927 Smiling Cloud Ave
- 6904 Smiling Cloud Ave
- 866 Angwin Ln
- 864 Angwin Ln
- 823 Atleigh Ave
- 862 Angwin Ln
- 681 Salt Flats Cir
- 859 Angwin Ln
- 852 Angwin Ln
- 949 Adobe Flat Dr
- 731 Emerald Idol Place
- 833 Aspen Peak Loop Unit 1314
- 833 Aspen Peak Loop Unit 2222
- 833 Aspen Peak Loop Unit 1716
- 833 Aspen Peak Loop Unit 2226
- 833 Aspen Peak Loop Unit 1124
- 833 Aspen Peak Loop Unit 1522
- 833 Aspen Peak Loop Unit 2216
- 833 Aspen Peak Loop Unit 2713
- 833 Aspen Peak Loop Unit 1216
- 833 Aspen Peak Loop Unit 1116
- 833 Aspen Peak Loop Unit 2612
- 833 Aspen Peak Loop Unit 1511
- 833 Aspen Peak Loop Unit 2723
- 833 Aspen Peak Loop Unit 1711
- 833 Aspen Peak Loop Unit 1726
- 833 Aspen Peak Loop Unit 2412
- 833 Aspen Peak Loop Unit 2213
- 833 Aspen Peak Loop Unit 2111
- 833 Aspen Peak Loop Unit 2425
- 833 Aspen Peak Loop Unit 2224