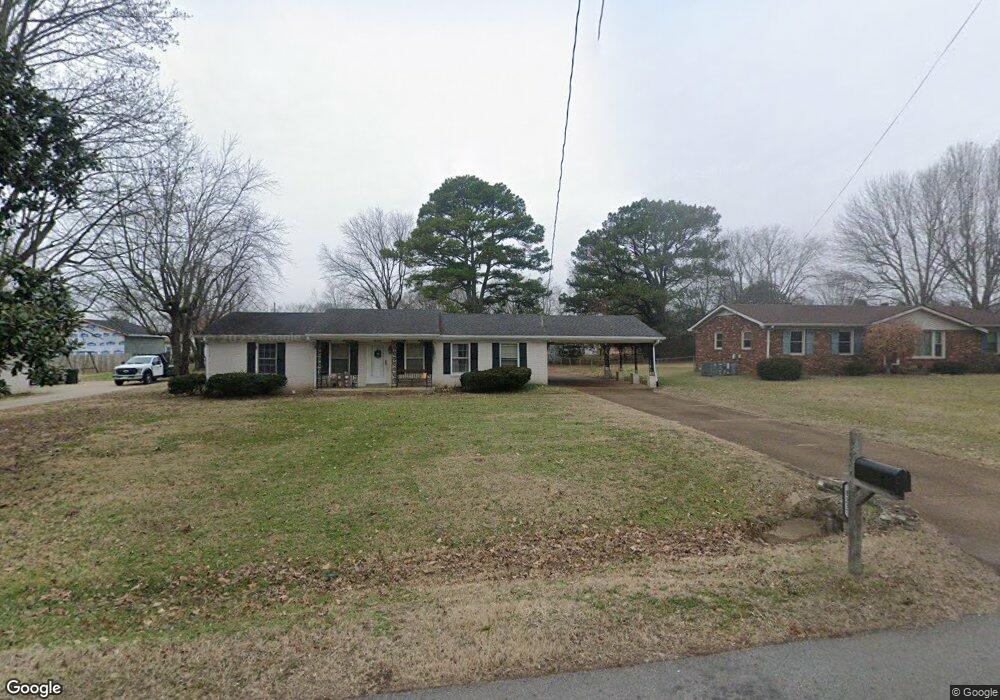
833 Duncan St Gallatin, TN 37066
Estimated Value: $303,000 - $318,000
--
Bed
1
Bath
1,400
Sq Ft
$221/Sq Ft
Est. Value
About This Home
This home is located at 833 Duncan St, Gallatin, TN 37066 and is currently estimated at $308,704, approximately $220 per square foot. 833 Duncan St is a home located in Sumner County with nearby schools including Guild Elementary School, Rucker Stewart Middle School, and Gallatin Senior High School.
Ownership History
Date
Name
Owned For
Owner Type
Purchase Details
Closed on
Mar 30, 2020
Sold by
Hester Patrick Terrence
Bought by
Hester Anne Nichole
Current Estimated Value
Purchase Details
Closed on
Sep 30, 2013
Sold by
Terry Ronald Cordell and Brown Jane T
Bought by
Hester Anne N
Home Financials for this Owner
Home Financials are based on the most recent Mortgage that was taken out on this home.
Original Mortgage
$117,727
Interest Rate
4.2%
Mortgage Type
FHA
Create a Home Valuation Report for This Property
The Home Valuation Report is an in-depth analysis detailing your home's value as well as a comparison with similar homes in the area
Home Values in the Area
Average Home Value in this Area
Purchase History
| Date | Buyer | Sale Price | Title Company |
|---|---|---|---|
| Hester Anne Nichole | -- | None Available | |
| Hester Anne N | $119,900 | None Available |
Source: Public Records
Mortgage History
| Date | Status | Borrower | Loan Amount |
|---|---|---|---|
| Previous Owner | Hester Anne N | $117,727 |
Source: Public Records
Tax History Compared to Growth
Tax History
| Year | Tax Paid | Tax Assessment Tax Assessment Total Assessment is a certain percentage of the fair market value that is determined by local assessors to be the total taxable value of land and additions on the property. | Land | Improvement |
|---|---|---|---|---|
| 2024 | $1,015 | $71,400 | $17,500 | $53,900 |
| 2023 | $1,156 | $37,875 | $8,750 | $29,125 |
| 2022 | $1,160 | $37,875 | $8,750 | $29,125 |
| 2021 | $1,160 | $37,875 | $8,750 | $29,125 |
| 2020 | $1,160 | $37,875 | $8,750 | $29,125 |
| 2019 | $1,160 | $0 | $0 | $0 |
| 2018 | $853 | $0 | $0 | $0 |
| 2017 | $853 | $0 | $0 | $0 |
| 2016 | $611 | $0 | $0 | $0 |
| 2015 | -- | $0 | $0 | $0 |
| 2014 | -- | $0 | $0 | $0 |
Source: Public Records
Map
Nearby Homes