833 Main St Blackshear, GA 31516
Estimated Value: $55,153
Studio
--
Bath
944
Sq Ft
$58/Sq Ft
Est. Value
About This Home
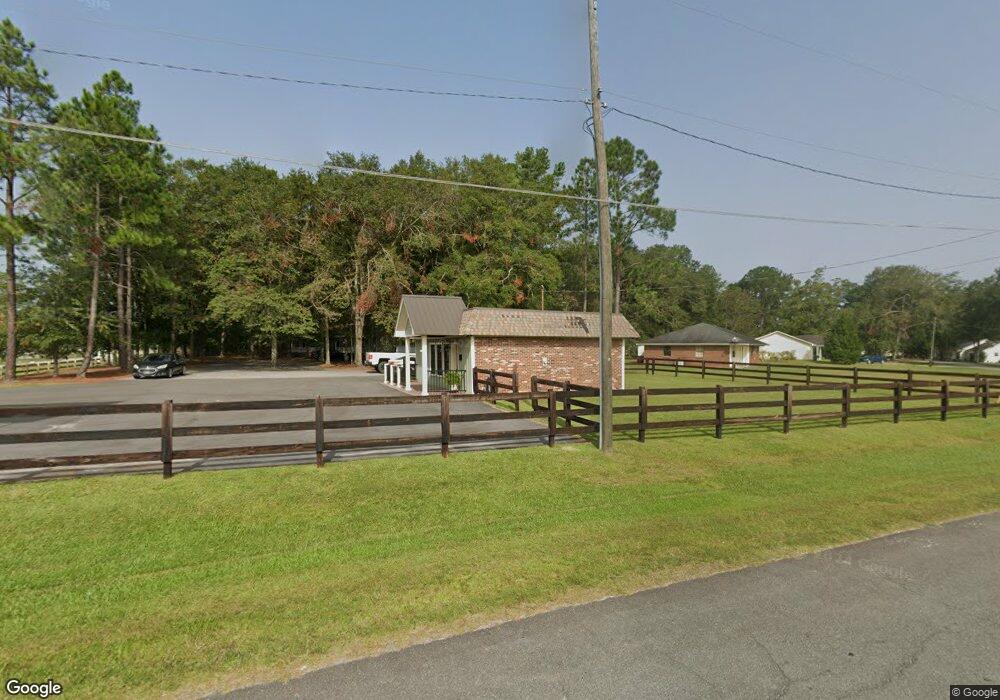
This home is located at 833 Main St, Blackshear, GA 31516 and is currently estimated at $55,153, approximately $58 per square foot. 833 Main St is a home located in Pierce County with nearby schools including Pierce County High School, Southeast Christian Academy, and Truth Christian Academy.
Ownership History
Date
Name
Owned For
Owner Type
Purchase Details
Closed on
Nov 30, 2016
Sold by
Ronald L
Bought by
D Green & Co Llc
Current Estimated Value
Purchase Details
Closed on
Feb 10, 2012
Sold by
Johnson Ronald L
Bought by
Johnson Ronald L
Purchase Details
Closed on
Jun 10, 2002
Sold by
Marsh Jerry D and Marsh Glo
Bought by
Morgan John R and Morgan Maude L
Purchase Details
Closed on
Dec 18, 2000
Sold by
Barnard Lea A
Bought by
Marsh Jerry D and Marsh Glo
Purchase Details
Closed on
Apr 10, 1990
Sold by
Barnard Daniel D Est
Bought by
Barnard Lea A
Purchase Details
Closed on
Jan 7, 1990
Sold by
Barnard Daniel D Jr Est
Bought by
Barnard Lea A
Purchase Details
Closed on
Jan 7, 1982
Sold by
Kinlaw Steven E
Bought by
Barnard Barnard D and Barnard Beatrice K
Purchase Details
Closed on
Oct 10, 1974
Sold by
Pierce Development Company Inc
Bought by
Barnard Beatrice and Barnard Kinlaw D
Create a Home Valuation Report for This Property
The Home Valuation Report is an in-depth analysis detailing your home's value as well as a comparison with similar homes in the area
Home Values in the Area
Average Home Value in this Area
Purchase History
| Date | Buyer | Sale Price | Title Company |
|---|---|---|---|
| D Green & Co Llc | $26,500 | -- | |
| Johnson Ronald L | -- | -- | |
| Johnson Ronald L | -- | -- | |
| Johnson Ronald L | -- | -- | |
| Morgan John R | $32,500 | -- | |
| Marsh Jerry D | $30,000 | -- | |
| Barnard Lea A | -- | -- | |
| Barnard Lea A | -- | -- | |
| Barnard Barnard D | -- | -- | |
| Barnard Beatrice | -- | -- |
Source: Public Records
Tax History
| Year | Tax Paid | Tax Assessment Tax Assessment Total Assessment is a certain percentage of the fair market value that is determined by local assessors to be the total taxable value of land and additions on the property. | Land | Improvement |
|---|---|---|---|---|
| 2025 | $831 | $25,927 | $2,800 | $23,127 |
| 2024 | $831 | $25,927 | $2,800 | $23,127 |
| 2023 | $831 | $25,927 | $2,800 | $23,127 |
| 2022 | $654 | $17,216 | $3,696 | $13,520 |
| 2021 | $704 | $17,216 | $3,696 | $13,520 |
| 2020 | $713 | $17,216 | $3,696 | $13,520 |
| 2019 | $713 | $17,216 | $3,696 | $13,520 |
| 2018 | $430 | $10,348 | $3,696 | $6,652 |
| 2017 | $431 | $10,348 | $3,696 | $6,652 |
| 2016 | $430 | $10,348 | $3,696 | $6,652 |
| 2015 | $509 | $10,348 | $3,696 | $6,652 |
| 2014 | $509 | $10,348 | $3,696 | $6,652 |
| 2013 | $509 | $10,348 | $3,696 | $6,652 |
Source: Public Records
Map
Nearby Homes
- 918 Main St
- 933 Azalea St
- 622 E Main St
- 222 Edgewood Dr
- ST. ROUTE 121 Georgia 121
- 106 Pinehurst Dr
- 118 Pinehurst Dr
- 1120 Lakeview Dr
- 1120 College Ave
- 915 Jane St
- 420 Greenleaf St
- 854 Jenkins St
- 517 Lazy Ln
- 331 Central Ave W
- 121 Beaver Dr
- 420 Jackson St
- 5628 Bay Ln
- 121 Trapper Trail
- 4023 Redstone Cir
- 315 Strickland Ave
Your Personal Tour Guide
Ask me questions while you tour the home.