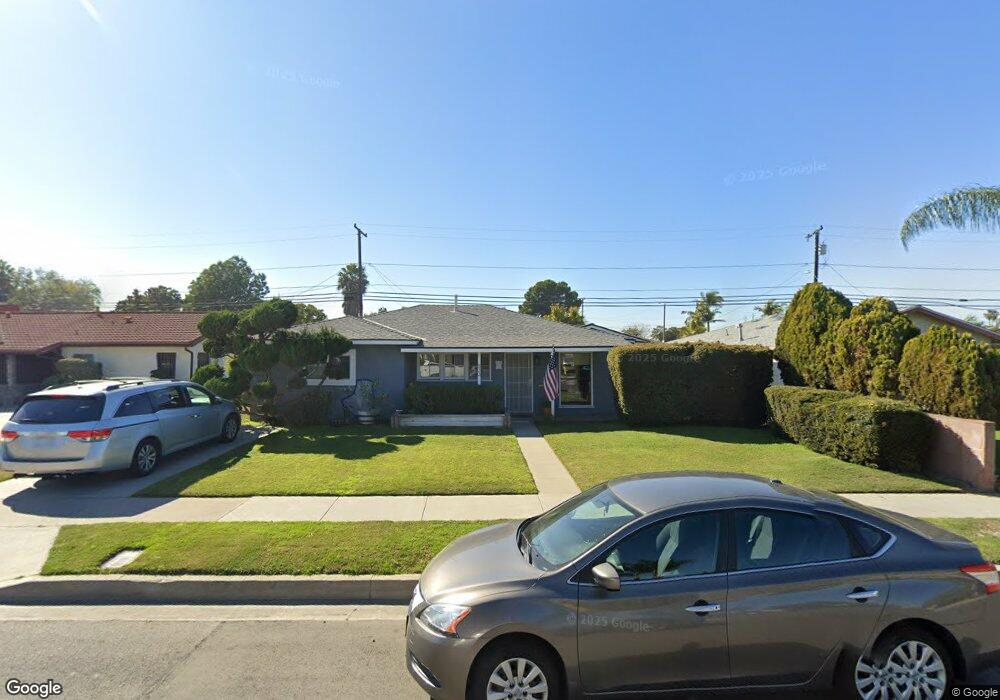
833 N Hanover St Anaheim, CA 92801
Northwest Anaheim NeighborhoodEstimated Value: $835,018 - $954,000
4
Beds
2
Baths
1,453
Sq Ft
$611/Sq Ft
Est. Value
About This Home
This home is located at 833 N Hanover St, Anaheim, CA 92801 and is currently estimated at $887,255, approximately $610 per square foot. 833 N Hanover St is a home located in Orange County with nearby schools including Dr. Peter Marshall Elementary School, Brookhurst Junior High School, and Savanna High School.
Ownership History
Date
Name
Owned For
Owner Type
Purchase Details
Closed on
Nov 22, 2017
Sold by
Declercq Adam M and Declercq Laura M
Bought by
Declerco Adam Miles and Declerco Lura Maie
Current Estimated Value
Purchase Details
Closed on
Feb 10, 2014
Sold by
Rambo Lyndall V
Bought by
Declercq Adam M and Declercq Laura M
Home Financials for this Owner
Home Financials are based on the most recent Mortgage that was taken out on this home.
Original Mortgage
$405,000
Outstanding Balance
$307,588
Interest Rate
4.47%
Mortgage Type
New Conventional
Estimated Equity
$579,667
Purchase Details
Closed on
May 8, 2009
Sold by
Rambo Patsy Ruth
Bought by
Rambo Patsy Ruth
Purchase Details
Closed on
Jul 6, 1998
Sold by
Rambo Patsy R
Bought by
Rambo Patsy R and Rambo Family Trust
Create a Home Valuation Report for This Property
The Home Valuation Report is an in-depth analysis detailing your home's value as well as a comparison with similar homes in the area
Home Values in the Area
Average Home Value in this Area
Purchase History
| Date | Buyer | Sale Price | Title Company |
|---|---|---|---|
| Declerco Adam Miles | -- | None Available | |
| Declercq Adam M | $430,000 | Fidelity National Title Oran | |
| Rambo Patsy Ruth | -- | None Available | |
| Rambo Patsy Ruth | -- | None Available | |
| Rambo Patsy R | -- | -- |
Source: Public Records
Mortgage History
| Date | Status | Borrower | Loan Amount |
|---|---|---|---|
| Open | Declercq Adam M | $405,000 |
Source: Public Records
Tax History Compared to Growth
Tax History
| Year | Tax Paid | Tax Assessment Tax Assessment Total Assessment is a certain percentage of the fair market value that is determined by local assessors to be the total taxable value of land and additions on the property. | Land | Improvement |
|---|---|---|---|---|
| 2025 | $5,902 | $527,115 | $458,541 | $68,574 |
| 2024 | $5,902 | $516,780 | $449,550 | $67,230 |
| 2023 | $5,749 | $506,648 | $440,736 | $65,912 |
| 2022 | $5,693 | $496,714 | $432,094 | $64,620 |
| 2021 | $5,624 | $486,975 | $423,622 | $63,353 |
| 2020 | $5,593 | $481,982 | $419,278 | $62,704 |
| 2019 | $5,452 | $472,532 | $411,057 | $61,475 |
| 2018 | $5,385 | $463,267 | $402,997 | $60,270 |
| 2017 | $5,193 | $454,184 | $395,095 | $59,089 |
| 2016 | $5,167 | $445,279 | $387,348 | $57,931 |
| 2015 | $5,123 | $438,591 | $381,530 | $57,061 |
| 2014 | $883 | $51,481 | $21,425 | $30,056 |
Source: Public Records
Map
Nearby Homes
- 2544 W Greenacre Ave
- 1006 N Hampton Place
- 1028 N Mayflower St
- 2625 W Cameron Ct Unit 121
- 728 N Geneva St
- 605 N La Reina St
- 525 N Gilbert St Unit 106
- 525 N Gilbert St Unit 151
- 1012 N Doria St
- 2709 W Madison Cir
- 8054 Teakwood Cir
- 8319 Hickory Dr
- 947 N Alamo St
- 199 N Magnolia Ave Unit B
- 400 N Syracuse St
- 615 N Ventura St
- 8434 Periwinkle Dr
- 1360 N Ferndale St
- 2540 W Picadilly Way
- 2697 W Parkside Ln
- 837 N Hanover St
- 829 N Hanover St
- 834 N Magnolia Ave
- 901 N Hanover St
- 825 N Hanover St
- 838 N Magnolia Ave
- 828 N Magnolia Ave
- 2564 W Glenoaks Ave
- 900 N Magnolia Ave
- 824 N Magnolia Ave
- 2565 W Glenoaks Ave
- 907 N Hanover St
- 824 N Hanover St
- 2560 W Glenoaks Ave
- 906 N Magnolia Ave
- 2561 W Glenoaks Ave
- 911 N Hanover St
- 817 N Hanover St
- 2556 W Glenoaks Ave
- 2564 W Glenhaven Ave