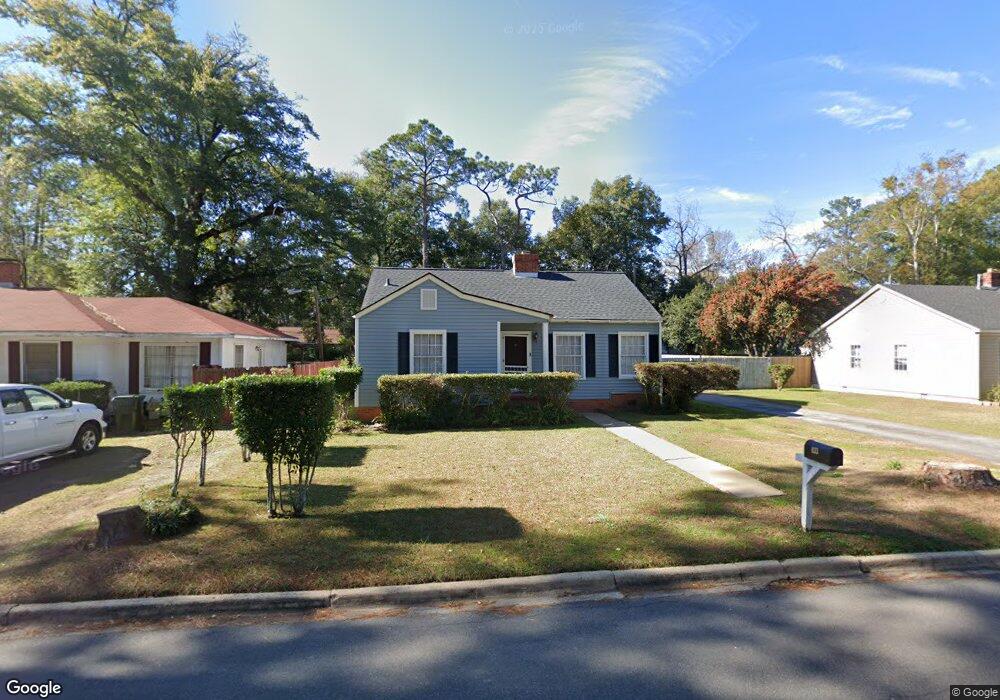
833 Rose Cir Bainbridge, GA 39819
Estimated Value: $122,000 - $159,000
Studio
1
Bath
1,096
Sq Ft
$129/Sq Ft
Est. Value
About This Home
This home is located at 833 Rose Cir, Bainbridge, GA 39819 and is currently estimated at $141,545, approximately $129 per square foot. 833 Rose Cir is a home located in Decatur County with nearby schools including Bainbridge High School and Grace Christian Academy.
Ownership History
Date
Name
Owned For
Owner Type
Purchase Details
Closed on
Jul 20, 2015
Sold by
Ritt Leah N
Bought by
Guerrero Jose L and Guerrero Sanjuanita D
Current Estimated Value
Home Financials for this Owner
Home Financials are based on the most recent Mortgage that was taken out on this home.
Original Mortgage
$81,720
Outstanding Balance
$63,322
Interest Rate
4.08%
Mortgage Type
VA
Estimated Equity
$78,223
Purchase Details
Closed on
Sep 20, 2006
Sold by
Mclendon Jerry E
Bought by
Ritt Leah N and Ritt Travis W
Home Financials for this Owner
Home Financials are based on the most recent Mortgage that was taken out on this home.
Original Mortgage
$101,000
Interest Rate
6.52%
Mortgage Type
New Conventional
Purchase Details
Closed on
Sep 27, 2005
Sold by
Hutchens Evelyn R
Bought by
Mclendon Jerry E and Mclendon Lisa S
Purchase Details
Closed on
Sep 19, 2005
Sold by
Johnson Wanda
Bought by
Hutchens Evelyn R
Create a Home Valuation Report for This Property
The Home Valuation Report is an in-depth analysis detailing your home's value as well as a comparison with similar homes in the area
Purchase History
We collect this data history from publicly available records. To have your information removed, we recommend requesting removal directly through your county’s website.
| Date | Buyer | Sale Price | Title Company |
|---|---|---|---|
| Guerrero Jose L | $80,000 | -- | |
| Ritt Leah N | $101,000 | -- | |
| Mclendon Jerry E | $69,000 | -- | |
| Hutchens Evelyn R | -- | -- | |
| Hutchens Evelyn R | -- | -- |
Source: Public Records
Mortgage History
We collect this data history from publicly available records. To have your information removed, we recommend requesting removal directly through your county’s website.
| Date | Status | Borrower | Loan Amount |
|---|---|---|---|
| Open | Guerrero Jose L | $81,720 | |
| Previous Owner | Ritt Leah N | $101,000 | |
| Closed | Mclendon Jerry E | $0 |
Source: Public Records
Tax History
| Year | Tax Paid | Tax Assessment Tax Assessment Total Assessment is a certain percentage of the fair market value that is determined by local assessors to be the total taxable value of land and additions on the property. | Land | Improvement |
|---|---|---|---|---|
| 2025 | $1,042 | $39,828 | $2,121 | $37,707 |
| 2024 | $1,014 | $33,859 | $2,121 | $31,738 |
| 2023 | $525 | $33,859 | $2,121 | $31,738 |
| 2022 | $967 | $33,119 | $2,121 | $30,998 |
| 2021 | $885 | $29,722 | $2,121 | $27,601 |
| 2020 | $812 | $26,030 | $2,121 | $23,909 |
| 2019 | $804 | $24,912 | $2,121 | $22,791 |
| 2018 | $795 | $24,912 | $2,121 | $22,791 |
| 2017 | $795 | $22,736 | $2,106 | $20,630 |
| 2016 | $735 | $22,735 | $2,106 | $20,630 |
| 2015 | $793 | $22,735 | $2,106 | $20,630 |
| 2014 | $735 | $22,062 | $2,106 | $19,957 |
| 2013 | -- | $22,062 | $2,105 | $19,956 |
Source: Public Records
Map
Nearby Homes
- 1024 Tallahassee Rd
- 925 E Evans St
- 904 Parham Ln
- 1106 E Pine St
- 1205 Tallahassee Rd
- 640 E Shotwell St
- 409 E Evans St
- Dell Rd
- 401 S Collier St
- 915 Anderson St
- 917 Anderson St
- 110 S Hall St
- 306 S Boulevard Dr
- 410 S Broad St
- 1102 E Water St
- 233 Meredith Dr
- 249 Meredith Dr
- 237 Meredith Dr
- Lot 3 Mountain View Way
- 0000 Mountain View Way
Your Personal Tour Guide
Ask me questions while you tour the home.