Estimated Value: $255,814 - $320,000
--
Bed
--
Bath
--
Sq Ft
1.11
Acres
About This Home
This home is located at 833 W 15th Place Unit 712W, Chicago, IL 60608 and is currently estimated at $277,204. 833 W 15th Place Unit 712W is a home located in Cook County with nearby schools including John M. Smyth Elementary I.B. World School, Wells Community Academy High School, and Youth Connection Leadership Academy.
Ownership History
Date
Name
Owned For
Owner Type
Purchase Details
Closed on
Aug 11, 2020
Sold by
Morein Maxwell Lonn and Hensley Jessica Lynn
Bought by
White Laura Christine
Current Estimated Value
Home Financials for this Owner
Home Financials are based on the most recent Mortgage that was taken out on this home.
Original Mortgage
$197,200
Interest Rate
2.9%
Mortgage Type
New Conventional
Purchase Details
Closed on
Aug 15, 2016
Sold by
Arguelles Eliseo M and Arguelles Nelly G
Bought by
Morein Maxwell Lonn and Hensley Jessica Lynn
Home Financials for this Owner
Home Financials are based on the most recent Mortgage that was taken out on this home.
Original Mortgage
$183,000
Interest Rate
3.41%
Mortgage Type
New Conventional
Purchase Details
Closed on
Jun 8, 2005
Sold by
Pugliese Anthony F
Bought by
Arguelles Eliseo M and Arguelles Nelly
Create a Home Valuation Report for This Property
The Home Valuation Report is an in-depth analysis detailing your home's value as well as a comparison with similar homes in the area
Home Values in the Area
Average Home Value in this Area
Purchase History
| Date | Buyer | Sale Price | Title Company |
|---|---|---|---|
| White Laura Christine | $232,000 | Old Republic Title | |
| Morein Maxwell Lonn | $193,000 | Chicago Title | |
| Arguelles Eliseo M | $260,000 | Multiple |
Source: Public Records
Mortgage History
| Date | Status | Borrower | Loan Amount |
|---|---|---|---|
| Previous Owner | White Laura Christine | $197,200 | |
| Previous Owner | Morein Maxwell Lonn | $183,000 |
Source: Public Records
Tax History Compared to Growth
Tax History
| Year | Tax Paid | Tax Assessment Tax Assessment Total Assessment is a certain percentage of the fair market value that is determined by local assessors to be the total taxable value of land and additions on the property. | Land | Improvement |
|---|---|---|---|---|
| 2024 | $3,491 | $22,202 | $990 | $21,212 |
| 2023 | $3,382 | $19,805 | $601 | $19,204 |
| 2022 | $3,382 | $19,805 | $601 | $19,204 |
| 2021 | $3,324 | $19,805 | $601 | $19,204 |
| 2020 | $3,177 | $17,318 | $601 | $16,717 |
| 2019 | $3,134 | $18,978 | $601 | $18,377 |
| 2018 | $3,080 | $18,978 | $601 | $18,377 |
| 2017 | $2,414 | $14,553 | $530 | $14,023 |
| 2016 | $2,915 | $14,553 | $530 | $14,023 |
| 2015 | $2,667 | $14,553 | $530 | $14,023 |
| 2014 | $2,668 | $14,380 | $450 | $13,930 |
| 2013 | $2,615 | $14,380 | $450 | $13,930 |
Source: Public Records
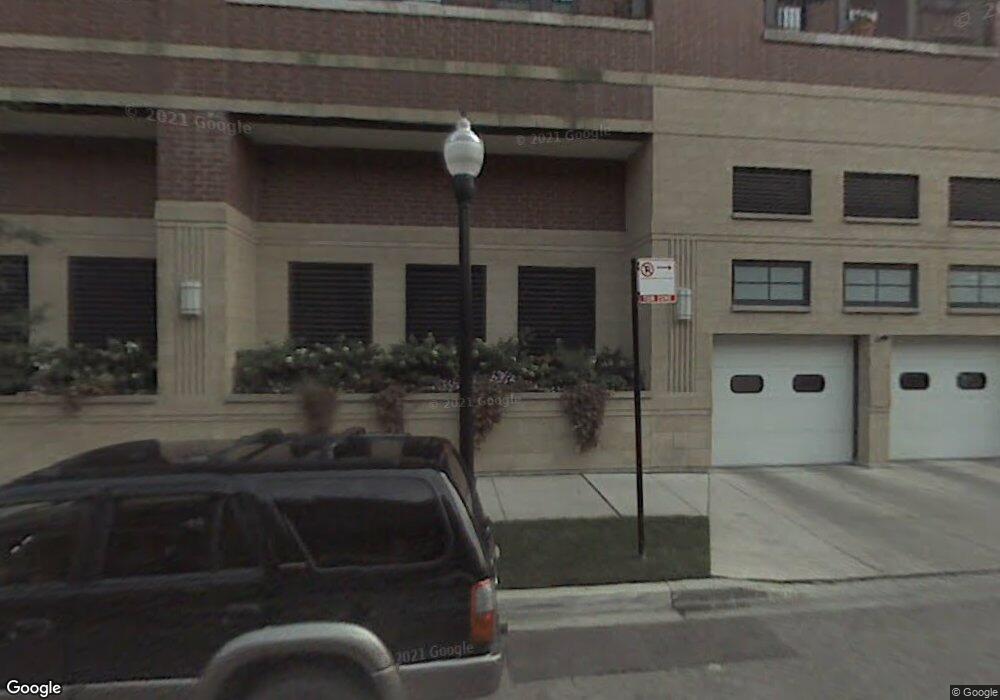
About This Building
Map
Nearby Homes
- 833 W 15th Place Unit 606W
- 833 W 15th Place Unit 514E
- 811 W 15th Place Unit 709
- 811 W 15th Place Unit 806E
- 811 W 15th Place Unit 708
- 811 W 15th Place Unit 513
- 1525 S Sangamon St Unit 514P
- 1525 S Sangamon St Unit 711P
- 1525 S Sangamon St Unit 315P
- 1525 S Sangamon St Unit 317P
- 1512 S Halsted St
- 1524 S Sangamon St Unit 413-S
- 1524 S Sangamon St Unit 401
- 1524 S Sangamon St Unit 512
- 1524 S Sangamon St Unit 414S
- 1524 S Sangamon St Unit 802
- 834 W Village Ct
- 1610 S Halsted St Unit 504
- 948 W 15th Place Unit 1B
- 743 W 15th St
- 833 W 15th Place Unit 809W
- 833 W 15th Place Unit 904W
- 833 W 15th Place Unit 814W
- 833 W 15th Place Unit 813W
- 833 W 15th Place Unit 807W
- 833 W 15th Place Unit 801W
- 833 W 15th Place Unit 710W
- 833 W 15th Place Unit 705W
- 833 W 15th Place Unit 702W
- 833 W 15th Place Unit 611W
- 833 W 15th Place Unit 609W
- 833 W 15th Place Unit 608W
- 833 W 15th Place Unit 607W
- 833 W 15th Place Unit 510W
- 833 W 15th Place Unit 503W
- 833 W 15th Place Unit 502W
- 833 W 15th Place Unit 415W
- 833 W 15th Place Unit 407W
- 833 W 15th Place Unit 314W
- 833 W 15th Place Unit 307W