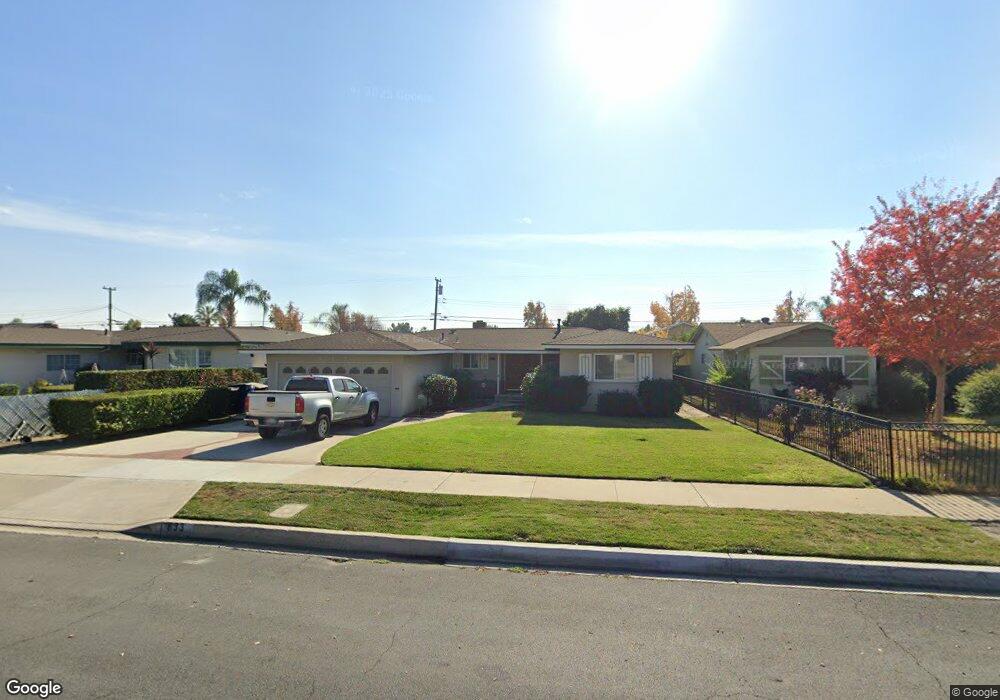
833 W Hawthorne St Ontario, CA 91762
Downtown Ontario NeighborhoodEstimated Value: $686,000 - $765,000
3
Beds
2
Baths
1,529
Sq Ft
$472/Sq Ft
Est. Value
About This Home
This home is located at 833 W Hawthorne St, Ontario, CA 91762 and is currently estimated at $720,928, approximately $471 per square foot. 833 W Hawthorne St is a home located in San Bernardino County with nearby schools including Hawthorne Elementary, Vina Danks Middle, and Chaffey High School.
Ownership History
Date
Name
Owned For
Owner Type
Purchase Details
Closed on
Oct 19, 2017
Sold by
Broyles Steven
Bought by
Broyles Steven T and Broyles Suzanne A
Current Estimated Value
Home Financials for this Owner
Home Financials are based on the most recent Mortgage that was taken out on this home.
Original Mortgage
$160,000
Outstanding Balance
$133,719
Interest Rate
3.93%
Mortgage Type
New Conventional
Estimated Equity
$587,209
Purchase Details
Closed on
Aug 31, 2017
Sold by
Irwin Randal Kevin
Bought by
Broyles Steven and Broyles Suzanne
Home Financials for this Owner
Home Financials are based on the most recent Mortgage that was taken out on this home.
Original Mortgage
$160,000
Outstanding Balance
$133,719
Interest Rate
3.93%
Mortgage Type
New Conventional
Estimated Equity
$587,209
Purchase Details
Closed on
Jul 28, 2017
Sold by
Irwin Randal Kevin
Bought by
Irwin Randal Kevin
Home Financials for this Owner
Home Financials are based on the most recent Mortgage that was taken out on this home.
Original Mortgage
$160,000
Outstanding Balance
$133,719
Interest Rate
3.93%
Mortgage Type
New Conventional
Estimated Equity
$587,209
Purchase Details
Closed on
Jan 25, 2001
Sold by
May Irwin Aubrey Earl
Bought by
May Irwin Aubrey Earl and May Irwin Margaret
Create a Home Valuation Report for This Property
The Home Valuation Report is an in-depth analysis detailing your home's value as well as a comparison with similar homes in the area
Home Values in the Area
Average Home Value in this Area
Purchase History
| Date | Buyer | Sale Price | Title Company |
|---|---|---|---|
| Broyles Steven T | -- | None Available | |
| Broyles Steven | $200,000 | Advantage Title Llc | |
| Irwin Randal Kevin | -- | None Available | |
| May Irwin Aubrey Earl | -- | -- |
Source: Public Records
Mortgage History
| Date | Status | Borrower | Loan Amount |
|---|---|---|---|
| Open | Broyles Steven | $160,000 |
Source: Public Records
Tax History Compared to Growth
Tax History
| Year | Tax Paid | Tax Assessment Tax Assessment Total Assessment is a certain percentage of the fair market value that is determined by local assessors to be the total taxable value of land and additions on the property. | Land | Improvement |
|---|---|---|---|---|
| 2025 | $5,013 | $466,396 | $163,848 | $302,548 |
| 2024 | $5,013 | $457,251 | $160,635 | $296,616 |
| 2023 | $4,872 | $448,285 | $157,485 | $290,800 |
| 2022 | $4,808 | $439,495 | $154,397 | $285,098 |
| 2021 | $4,778 | $430,878 | $151,370 | $279,508 |
| 2020 | $4,694 | $426,460 | $149,818 | $276,642 |
| 2019 | $4,654 | $418,098 | $146,880 | $271,218 |
| 2018 | $4,590 | $409,900 | $144,000 | $265,900 |
| 2017 | $632 | $62,732 | $12,645 | $50,087 |
| 2016 | $606 | $61,502 | $12,397 | $49,105 |
| 2015 | $601 | $60,578 | $12,211 | $48,367 |
| 2014 | $581 | $59,392 | $11,972 | $47,420 |
Source: Public Records
Map
Nearby Homes
- 945 W Bonnie Brae Ct
- 1557 N Beverly Ct
- 703 W 7th St
- 1163 W Princeton St
- 1456 N Elderberry Ave
- 340 W Caroline Ct
- 424 W 7th St
- 1111 W J St
- 384 W 7th St
- 631 W Berkeley Ct
- 1105 W Berkeley Ct
- 278 Verdugo Way
- 862 Sheridan St
- Plan 3 at Canopy
- Plan 4 at Canopy
- 1324 W Oakcrest Paseo
- 1326 W Oakcrest Paseo
- 1353 W Princeton St
- 1164 W I St
- 247 Sinclair Ave
- 827 W Hawthorne St
- 843 W Hawthorne St
- 849 W Hawthorne St
- 823 W Hawthorne St
- 844 W Bonnie Brae Ct
- 840 W Bonnie Brae Ct
- 846 W Bonnie Brae Ct
- 834 W Bonnie Brae Ct
- 852 W Bonnie Brae Ct
- 855 W Hawthorne St
- 840 W Hawthorne St
- 817 W Hawthorne St
- 832 W Hawthorne St
- 848 W Hawthorne St
- 830 W Bonnie Brae Ct
- 856 W Bonnie Brae Ct
- 826 W Hawthorne St
- 863 W Hawthorne St
- 856 W Hawthorne St
- 809 W Hawthorne St