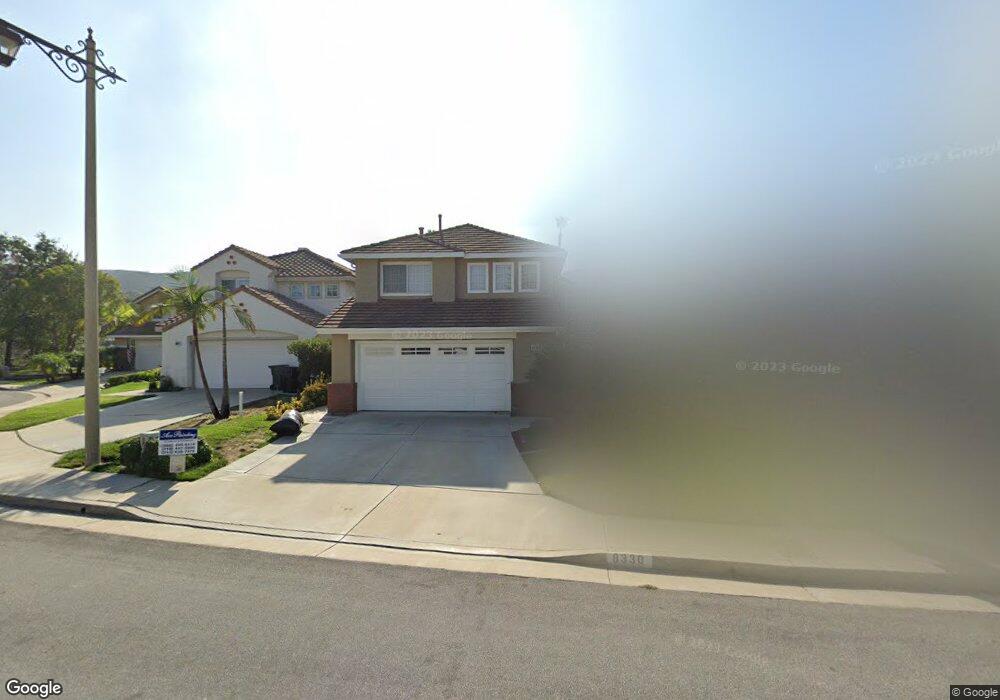
8330 E Starcrest Ct Anaheim, CA 92808
Anaheim Hills NeighborhoodEstimated Value: $1,068,000 - $1,201,000
3
Beds
3
Baths
1,737
Sq Ft
$647/Sq Ft
Est. Value
About This Home
This home is located at 8330 E Starcrest Ct, Anaheim, CA 92808 and is currently estimated at $1,123,090, approximately $646 per square foot. 8330 E Starcrest Ct is a home located in Orange County with nearby schools including Running Springs Elementary, Canyon High School, and El Rancho Charter.
Ownership History
Date
Name
Owned For
Owner Type
Purchase Details
Closed on
May 9, 2025
Sold by
Calvert Kim Duane and Calvert Marnel Stephanie
Bought by
Calvert Revocable Trust and Calvert
Current Estimated Value
Purchase Details
Closed on
May 20, 1997
Sold by
Richard Muhich and Richard Arlene
Bought by
Calvert Kim Duane and Calvert Marnel Stephanie
Home Financials for this Owner
Home Financials are based on the most recent Mortgage that was taken out on this home.
Original Mortgage
$200,700
Interest Rate
8.08%
Purchase Details
Closed on
Aug 23, 1995
Sold by
Fulghum Barry Scott and Fulghum Karen Ann
Bought by
Muhich Richard and Muhich Arlene
Home Financials for this Owner
Home Financials are based on the most recent Mortgage that was taken out on this home.
Original Mortgage
$175,200
Interest Rate
7.97%
Create a Home Valuation Report for This Property
The Home Valuation Report is an in-depth analysis detailing your home's value as well as a comparison with similar homes in the area
Home Values in the Area
Average Home Value in this Area
Purchase History
| Date | Buyer | Sale Price | Title Company |
|---|---|---|---|
| Calvert Revocable Trust | -- | None Listed On Document | |
| Calvert Kim Duane | $223,000 | Orange Coast Title | |
| Muhich Richard | $219,000 | Fidelity National Title Ins |
Source: Public Records
Mortgage History
| Date | Status | Borrower | Loan Amount |
|---|---|---|---|
| Previous Owner | Calvert Kim Duane | $200,700 | |
| Previous Owner | Muhich Richard | $175,200 |
Source: Public Records
Tax History
| Year | Tax Paid | Tax Assessment Tax Assessment Total Assessment is a certain percentage of the fair market value that is determined by local assessors to be the total taxable value of land and additions on the property. | Land | Improvement |
|---|---|---|---|---|
| 2025 | $4,081 | $363,187 | $97,439 | $265,748 |
| 2024 | $4,081 | $356,066 | $95,528 | $260,538 |
| 2023 | $3,988 | $349,085 | $93,655 | $255,430 |
| 2022 | $3,907 | $342,241 | $91,819 | $250,422 |
| 2021 | $3,799 | $335,531 | $90,019 | $245,512 |
| 2020 | $3,764 | $332,091 | $89,096 | $242,995 |
| 2019 | $3,717 | $325,580 | $87,349 | $238,231 |
| 2018 | $3,659 | $319,197 | $85,637 | $233,560 |
| 2017 | $3,510 | $312,939 | $83,958 | $228,981 |
| 2016 | $3,443 | $306,803 | $82,311 | $224,492 |
| 2015 | $3,362 | $302,195 | $81,075 | $221,120 |
| 2014 | $3,323 | $296,276 | $79,487 | $216,789 |
Source: Public Records
Map
Nearby Homes
- 1232 S Country Glen Way
- 1358 S Country Glen Way Unit D
- 1370 S Country Glen Way
- 8346 E Quiet Canyon Ct
- 8176 E Bailey Way
- 8750 E Heatherwood Rd
- 8830 E Wiley Way Unit 20
- 8109 E Bailey Way
- 8142 E Naples Ln
- 1099 S San Marino Way
- 910 S Barton Ct
- 8027 E Naples Ln
- 8047 E Sandstone Dr
- 7835 E Viewrim Dr
- 520 S Morningstar Dr
- 7912 E Monte Carlo Ave
- 7904 E Monte Carlo Ave Unit 199
- 518 S Laureltree Dr
- 927 S Firefly Dr
- 8070 E Goldenrod Ln Unit 49
- 8320 E Starcrest Ct
- 8340 E Starcrest Ct
- 8300 E Starcrest Ct
- 1152 S Silver Star Way
- 8350 E Starcrest Ct
- 1160 S Silver Star Way
- 8321 E Starcrest Ct
- 1168 S Silver Star Way
- 8331 E Starcrest Ct
- 8311 E Starcrest Ct
- 8341 E Starcrest Ct
- 8301 E Starcrest Ct
- 8351 E Starcrest Ct
- 8361 E Starcrest Ct
- 1176 S Silver Star Way
- 1135 S Silver Star Way
- 1143 S Silver Star Way
- 1127 S Silver Star Way
- 1151 S Silver Star Way
- 1119 S Silver Star Way
Your Personal Tour Guide
Ask me questions while you tour the home.