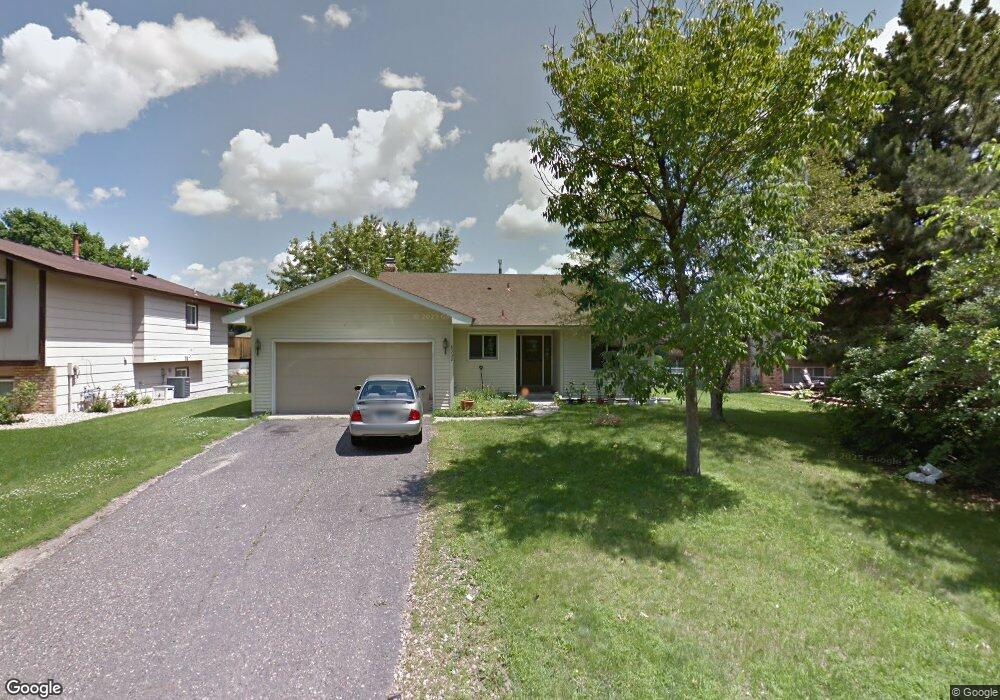
8332 Kentucky Ave N Brooklyn Park, MN 55445
Candlewood NeighborhoodEstimated Value: $339,302 - $372,000
3
Beds
2
Baths
1,192
Sq Ft
$296/Sq Ft
Est. Value
About This Home
This home is located at 8332 Kentucky Ave N, Brooklyn Park, MN 55445 and is currently estimated at $353,076, approximately $296 per square foot. 8332 Kentucky Ave N is a home located in Hennepin County with nearby schools including Edinbrook Elementary School, North View Middle School, and Osseo Senior High School.
Ownership History
Date
Name
Owned For
Owner Type
Purchase Details
Closed on
Apr 11, 2016
Sold by
Reynolds Aron
Bought by
Vang Khue
Current Estimated Value
Home Financials for this Owner
Home Financials are based on the most recent Mortgage that was taken out on this home.
Original Mortgage
$206,196
Outstanding Balance
$163,810
Interest Rate
3.68%
Mortgage Type
FHA
Estimated Equity
$189,266
Purchase Details
Closed on
Nov 1, 2015
Sold by
Dejvongsa Nouphet and Dejvongsa Khone
Bought by
Reynolds Aron and Estate Of Leslie J Reynolds
Purchase Details
Closed on
Oct 1, 2010
Sold by
Reynolds Leslie
Bought by
Dejvengsa Nouphet and Dejvengsa Khune
Home Financials for this Owner
Home Financials are based on the most recent Mortgage that was taken out on this home.
Original Mortgage
$198,300
Interest Rate
6.42%
Mortgage Type
Land Contract Argmt. Of Sale
Purchase Details
Closed on
Dec 18, 2008
Sold by
Wachovia Mortgage Fsb
Bought by
Reynolds Leslie J
Create a Home Valuation Report for This Property
The Home Valuation Report is an in-depth analysis detailing your home's value as well as a comparison with similar homes in the area
Home Values in the Area
Average Home Value in this Area
Purchase History
| Date | Buyer | Sale Price | Title Company |
|---|---|---|---|
| Vang Khue | $210,000 | Titlesmart Inc | |
| Reynolds Aron | -- | None Available | |
| Dejvengsa Nouphet | $201,000 | -- | |
| Reynolds Leslie J | $104,900 | -- |
Source: Public Records
Mortgage History
| Date | Status | Borrower | Loan Amount |
|---|---|---|---|
| Open | Vang Khue | $206,196 | |
| Previous Owner | Dejvengsa Nouphet | $198,300 |
Source: Public Records
Tax History Compared to Growth
Tax History
| Year | Tax Paid | Tax Assessment Tax Assessment Total Assessment is a certain percentage of the fair market value that is determined by local assessors to be the total taxable value of land and additions on the property. | Land | Improvement |
|---|---|---|---|---|
| 2024 | $4,190 | $301,100 | $125,000 | $176,100 |
| 2023 | $4,121 | $305,300 | $125,000 | $180,300 |
| 2022 | $3,039 | $290,600 | $125,000 | $165,600 |
| 2021 | $3,053 | $229,600 | $58,000 | $171,600 |
| 2020 | $3,014 | $230,700 | $58,000 | $172,700 |
| 2019 | $3,009 | $217,700 | $58,000 | $159,700 |
| 2018 | $2,795 | $207,300 | $51,600 | $155,700 |
| 2017 | $2,536 | $171,000 | $51,600 | $119,400 |
| 2016 | $2,865 | $170,200 | $51,600 | $118,600 |
| 2015 | $2,768 | $159,900 | $41,300 | $118,600 |
| 2014 | -- | $131,300 | $41,300 | $90,000 |
Source: Public Records
Map
Nearby Homes
- 8357 Jersey Ave N
- 6716 83rd Ave N
- 8233 Hampshire Ct N
- 6614 84th Ct N
- 6526 83rd Ct N
- 6523 84th Ct N Unit 6523
- 6517 83rd Ct N
- 8657 Tessman Cir N
- 8614 Tessman Pkwy N
- 6415 84th Ct N
- 8033 Georgia Ave N
- 8526 S Maplebrook Cir
- 8576 S Maplebrook Cir
- 6419 Tessman Terrace N
- 8400 Brunswick Ave N
- 8740 N Maplebrook Cir
- 7817 83rd Ave N
- 6236 Creekview Ln N
- 6508 88th Ave N
- 7892 83rd Ct N
- 8340 Kentucky Ave N
- 8324 Kentucky Ave N
- 8325 Jersey Ave N
- 8316 Kentucky Ave N
- 8348 Kentucky Ave N
- 8333 Kentucky Ave N
- 8333 Jersey Ave N
- 8317 Jersey Ave N
- 8356 Kentucky Ave N
- 8325 Kentucky Ave N
- 7016 83rd Ave N
- 7000 83rd Ave N
- 8317 Kentucky Ave N
- 8349 Kentucky Ave N
- 6916 83rd Ave N
- 8364 Kentucky Ave N
- 8308 Jersey Ave N
- 8341 Jersey Ave N
- 6908 83rd Ave N
- 8309 Kentucky Ave N