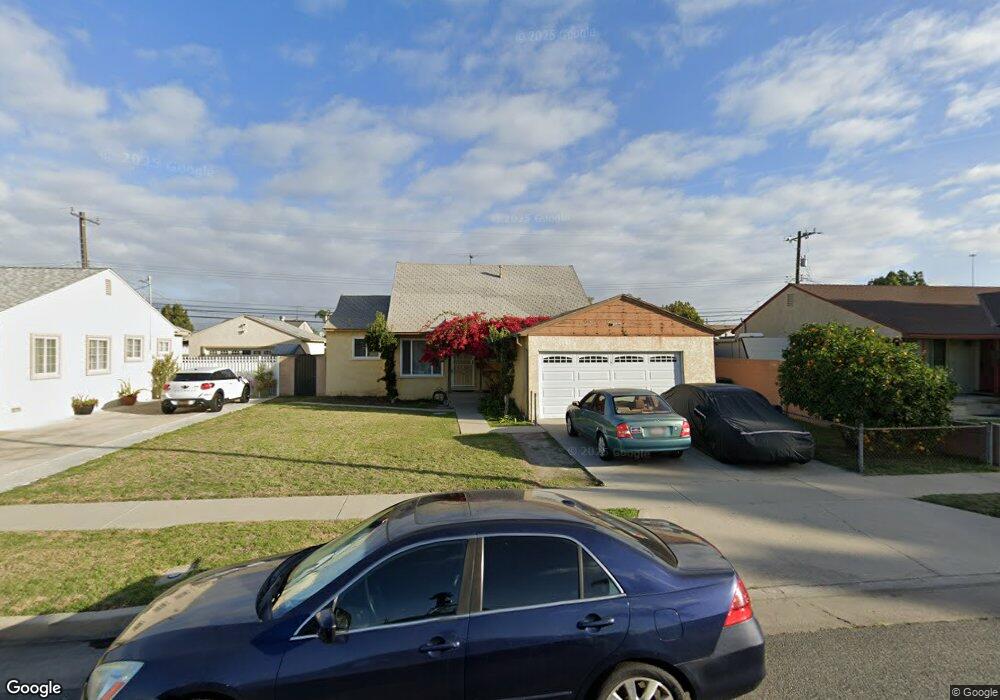
8333 Calendula Dr Buena Park, CA 90620
Estimated Value: $854,000 - $875,000
4
Beds
2
Baths
1,418
Sq Ft
$610/Sq Ft
Est. Value
About This Home
This home is located at 8333 Calendula Dr, Buena Park, CA 90620 and is currently estimated at $864,586, approximately $609 per square foot. 8333 Calendula Dr is a home located in Orange County with nearby schools including Mabel L. Pendleton Elementary School, Buena Park Junior High School, and Buena Park High School.
Ownership History
Date
Name
Owned For
Owner Type
Purchase Details
Closed on
May 16, 2001
Sold by
Garretson Evan I and Garretson Leta M
Bought by
Sander David W and Sander Elaine G
Current Estimated Value
Home Financials for this Owner
Home Financials are based on the most recent Mortgage that was taken out on this home.
Original Mortgage
$196,000
Outstanding Balance
$73,782
Interest Rate
7.14%
Estimated Equity
$790,804
Purchase Details
Closed on
May 14, 1999
Sold by
Marguerite Jones
Bought by
Sander David W and Sander Elaine G
Home Financials for this Owner
Home Financials are based on the most recent Mortgage that was taken out on this home.
Original Mortgage
$194,189
Interest Rate
6.84%
Mortgage Type
FHA
Purchase Details
Closed on
Sep 2, 1994
Sold by
Jones Marguerite M
Bought by
Jones Marguerite M and Marguerite M Jones Living Trust
Create a Home Valuation Report for This Property
The Home Valuation Report is an in-depth analysis detailing your home's value as well as a comparison with similar homes in the area
Home Values in the Area
Average Home Value in this Area
Purchase History
| Date | Buyer | Sale Price | Title Company |
|---|---|---|---|
| Sander David W | -- | United Title Company | |
| Sander David W | $196,500 | Commonwealth Land Title | |
| Jones Marguerite M | -- | -- |
Source: Public Records
Mortgage History
| Date | Status | Borrower | Loan Amount |
|---|---|---|---|
| Open | Sander David W | $196,000 | |
| Closed | Sander David W | $194,189 |
Source: Public Records
Tax History Compared to Growth
Tax History
| Year | Tax Paid | Tax Assessment Tax Assessment Total Assessment is a certain percentage of the fair market value that is determined by local assessors to be the total taxable value of land and additions on the property. | Land | Improvement |
|---|---|---|---|---|
| 2025 | $3,705 | $319,767 | $242,024 | $77,743 |
| 2024 | $3,705 | $313,498 | $237,279 | $76,219 |
| 2023 | $3,626 | $307,351 | $232,626 | $74,725 |
| 2022 | $3,564 | $301,325 | $228,065 | $73,260 |
| 2021 | $3,536 | $295,417 | $223,593 | $71,824 |
| 2020 | $3,492 | $292,388 | $221,300 | $71,088 |
| 2019 | $3,411 | $286,655 | $216,960 | $69,695 |
| 2018 | $3,345 | $281,035 | $212,706 | $68,329 |
| 2017 | $3,296 | $275,525 | $208,535 | $66,990 |
| 2016 | $3,230 | $270,123 | $204,446 | $65,677 |
| 2015 | $3,093 | $266,066 | $201,375 | $64,691 |
| 2014 | $3,079 | $260,855 | $197,431 | $63,424 |
Source: Public Records
Map
Nearby Homes
- 8194 Calendula Dr
- 21 Centerstone Cir
- 7085 Oregon St
- 8026 Carnation Dr
- 7122 Stanton Ave
- 2697 W Parkside Ln
- 8434 Periwinkle Dr
- 7911 Orangethorpe Ave
- 4231 W Hill Ave
- 4260 W Flower Ave
- 8054 Teakwood Cir
- 7791 Melrose St
- 8927 Orangethorpe Ave
- 7575 El Escorial Way
- 7570 El Chaco Dr
- 6958 Crimson Dr
- 6921 Cottonwood Ln
- 7600 Western Ave
- 7451 Western Ave
- 2540 W Picadilly Way
- 8345 Calendula Dr
- 8321 Calendula Dr
- 8332 Portulaca Way
- 8320 Portulaca Way
- 8344 Portulaca Way
- 8357 Calendula Dr
- 8309 Calendula Dr
- 8356 Portulaca Way
- 8308 Portulaca Way
- 8332 Calendula Dr
- 8320 Calendula Dr
- 8344 Calendula Dr
- 8369 Calendula Dr
- 8297 Calendula Dr
- 8356 Calendula Dr
- 8308 Calendula Dr
- 8296 Portulaca Way
- 8368 Portulaca Way
- 8381 Calendula Dr
- 8368 Calendula Dr