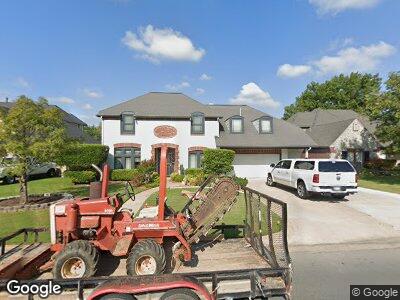
8334 S 98th East Ave Tulsa, OK 74133
Shadow Ridge NeighborhoodEstimated Value: $382,231 - $446,000
--
Bed
3
Baths
3,406
Sq Ft
$123/Sq Ft
Est. Value
About This Home
This home is located at 8334 S 98th East Ave, Tulsa, OK 74133 and is currently estimated at $418,058, approximately $122 per square foot. 8334 S 98th East Ave is a home located in Tulsa County with nearby schools including Cedar Ridge Elementary School, Union 6th-7th Grade Center, and Union 8th Grade Center.
Ownership History
Date
Name
Owned For
Owner Type
Purchase Details
Closed on
Feb 13, 2003
Sold by
Price Warren D and Price Naomi R
Bought by
Price Warren D and Price Naomi R
Current Estimated Value
Purchase Details
Closed on
Jul 15, 1999
Sold by
Price Warren David and Austria Naomi Ruth
Bought by
Price Warren D and Austria Naomi Ruth
Purchase Details
Closed on
Oct 24, 1997
Sold by
Design Mark Builders Inc
Bought by
Price Warren David and Austria Naomi Ruth
Home Financials for this Owner
Home Financials are based on the most recent Mortgage that was taken out on this home.
Original Mortgage
$160,000
Outstanding Balance
$35,130
Interest Rate
7.52%
Mortgage Type
Purchase Money Mortgage
Estimated Equity
$354,128
Purchase Details
Closed on
Jul 7, 1997
Sold by
Gordon Williams Development Inc
Bought by
Design Mark Builders Inc
Home Financials for this Owner
Home Financials are based on the most recent Mortgage that was taken out on this home.
Original Mortgage
$168,000
Interest Rate
9.5%
Mortgage Type
Purchase Money Mortgage
Create a Home Valuation Report for This Property
The Home Valuation Report is an in-depth analysis detailing your home's value as well as a comparison with similar homes in the area
Home Values in the Area
Average Home Value in this Area
Purchase History
| Date | Buyer | Sale Price | Title Company |
|---|---|---|---|
| Price Warren D | -- | First Amer Title & Abstract | |
| Price Warren D | -- | -- | |
| Price Warren David | $207,500 | -- | |
| Design Mark Builders Inc | $36,000 | Smith Bros Abstract Company |
Source: Public Records
Mortgage History
| Date | Status | Borrower | Loan Amount |
|---|---|---|---|
| Open | Price Warren D | $50,000 | |
| Open | Price Warren David | $160,000 | |
| Previous Owner | Design Mark Builders Inc | $168,000 |
Source: Public Records
Tax History Compared to Growth
Tax History
| Year | Tax Paid | Tax Assessment Tax Assessment Total Assessment is a certain percentage of the fair market value that is determined by local assessors to be the total taxable value of land and additions on the property. | Land | Improvement |
|---|---|---|---|---|
| 2024 | $3,810 | $30,719 | $3,043 | $27,676 |
| 2023 | $3,810 | $30,795 | $3,189 | $27,606 |
| 2022 | $3,850 | $28,898 | $3,941 | $24,957 |
| 2021 | $3,782 | $28,028 | $3,823 | $24,205 |
| 2020 | $3,615 | $27,182 | $3,926 | $23,256 |
| 2019 | $3,742 | $27,182 | $3,926 | $23,256 |
| 2018 | $3,733 | $27,182 | $3,926 | $23,256 |
| 2017 | $3,755 | $28,182 | $4,070 | $24,112 |
| 2016 | $3,672 | $28,182 | $4,070 | $24,112 |
| 2015 | $3,712 | $28,182 | $4,070 | $24,112 |
| 2014 | $3,654 | $28,182 | $4,070 | $24,112 |
Source: Public Records
Map
Nearby Homes
- 9818 E 83rd Place
- 8422 S 98th Ave E
- 7923 S 92nd Ct E
- 7948 S 92nd Place E
- 7815 E 79th St
- 7723 S 92nd Place E
- 7745 S 91st Ave E
- 9715 E 79th
- 7727 S 91st Ave E
- 8324 S 109th Ave E
- 8606 S 86th Ave E
- 9016 E 77th St
- 9319 E 92nd St
- 8839 E 77th Place
- 8449 S 110th Ave E
- 8408 S 84th Ave E
- 9135 S 90th Ave E
- 9132 S 89th Ave E
- 7713 S 86th East Ave
- 9306 S 94th Ave E
- 8334 S 98th East Ave
- 8338 S 98th East Ave
- 8330 S 98th East Ave
- 8342 S 98th East Ave
- 9810 E 83rd Place
- 8326 S 98th East Ave
- 9805 E 84th St
- 8344 S 98th East Ave
- 9803 E 83rd Place
- 9814 E 83rd Place
- 9809 E 83rd Place
- 9813 E 83rd Place
- 9811 E 84th St
- 8348 S 98th East Ave
- 9817 E 83rd Place
- 9815 E 84th St
- 9822 E 83rd Place
- 9823 E 83rd Place
- 9819 E 84th St
- 8422 S 98th East Ave