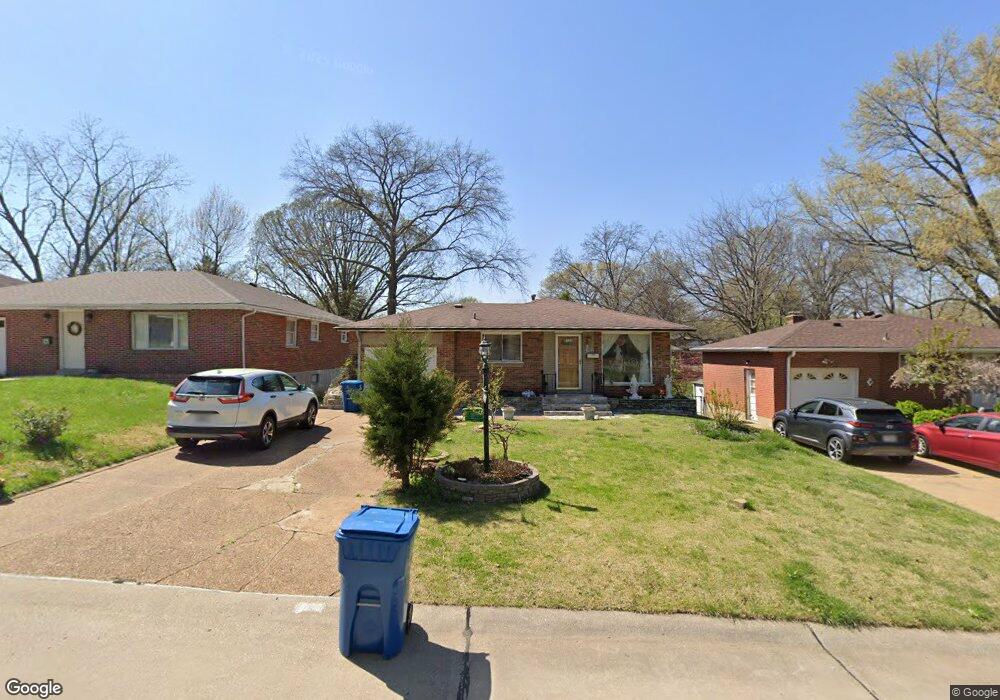
8335 Lonkar Dr Saint Louis, MO 63123
Estimated Value: $223,269 - $252,000
3
Beds
2
Baths
968
Sq Ft
$244/Sq Ft
Est. Value
About This Home
This home is located at 8335 Lonkar Dr, Saint Louis, MO 63123 and is currently estimated at $235,817, approximately $243 per square foot. 8335 Lonkar Dr is a home located in St. Louis County with nearby schools including Mesnier Primary School, Gotsch Intermediate School, and Rogers Middle School.
Ownership History
Date
Name
Owned For
Owner Type
Purchase Details
Closed on
Apr 28, 2017
Sold by
Vantran En and Vo Lai Thi
Bought by
Tran Phuong
Current Estimated Value
Purchase Details
Closed on
Jun 28, 2002
Sold by
Collier Jayne L
Bought by
Vanvantran En Van and Vo Lai Thi
Home Financials for this Owner
Home Financials are based on the most recent Mortgage that was taken out on this home.
Original Mortgage
$94,800
Outstanding Balance
$39,998
Interest Rate
6.78%
Estimated Equity
$195,819
Purchase Details
Closed on
Mar 20, 1999
Sold by
Stewart Anna M
Bought by
Stewart Anna M and Anna M Stewart Revocable Trust
Purchase Details
Closed on
Oct 13, 1998
Sold by
Katherine Bartesch
Bought by
Stewart Anna M
Home Financials for this Owner
Home Financials are based on the most recent Mortgage that was taken out on this home.
Original Mortgage
$24,000
Interest Rate
6.81%
Create a Home Valuation Report for This Property
The Home Valuation Report is an in-depth analysis detailing your home's value as well as a comparison with similar homes in the area
Home Values in the Area
Average Home Value in this Area
Purchase History
| Date | Buyer | Sale Price | Title Company |
|---|---|---|---|
| Tran Phuong | -- | None Available | |
| Vanvantran En Van | $118,500 | -- | |
| Stewart Anna M | -- | -- | |
| Stewart Anna M | -- | -- |
Source: Public Records
Mortgage History
| Date | Status | Borrower | Loan Amount |
|---|---|---|---|
| Open | Vanvantran En Van | $94,800 | |
| Previous Owner | Stewart Anna M | $24,000 |
Source: Public Records
Tax History Compared to Growth
Tax History
| Year | Tax Paid | Tax Assessment Tax Assessment Total Assessment is a certain percentage of the fair market value that is determined by local assessors to be the total taxable value of land and additions on the property. | Land | Improvement |
|---|---|---|---|---|
| 2025 | $2,866 | $40,110 | $14,540 | $25,570 |
| 2024 | $2,866 | $35,510 | $9,690 | $25,820 |
| 2023 | $2,770 | $35,510 | $9,690 | $25,820 |
| 2022 | $2,582 | $30,130 | $9,690 | $20,440 |
| 2021 | $2,522 | $30,130 | $9,690 | $20,440 |
| 2020 | $2,445 | $27,250 | $9,600 | $17,650 |
| 2019 | $2,440 | $27,250 | $9,600 | $17,650 |
| 2018 | $2,302 | $22,710 | $6,710 | $16,000 |
| 2017 | $2,288 | $22,710 | $6,710 | $16,000 |
| 2016 | $1,994 | $21,020 | $5,000 | $16,020 |
| 2015 | $2,004 | $21,020 | $5,000 | $16,020 |
| 2014 | $2,183 | $22,840 | $7,090 | $15,750 |
Source: Public Records
Map
Nearby Homes
- 8315 Maylor Dr
- 8305 Vasel Dr
- 8027 McGee St
- 8348 Vasel Dr
- 8019 Gramond Dr
- 5800 Langley Ave
- 8029 Joel Ave
- 8032 Joel Ave
- 8022 Joel Ave
- 7917 Menola St
- 5615 Willard Ave
- 8509 Mackenzie Rd
- 8505 Ava Dr
- 6325 Sheppard Dr
- 8506 Mathilda Ave
- 5900 Apple Valley Dr
- 5331 Vine Ave
- 6236 Bixby Ave
- 8034 Genesta St
- 6540 Lawnside Dr