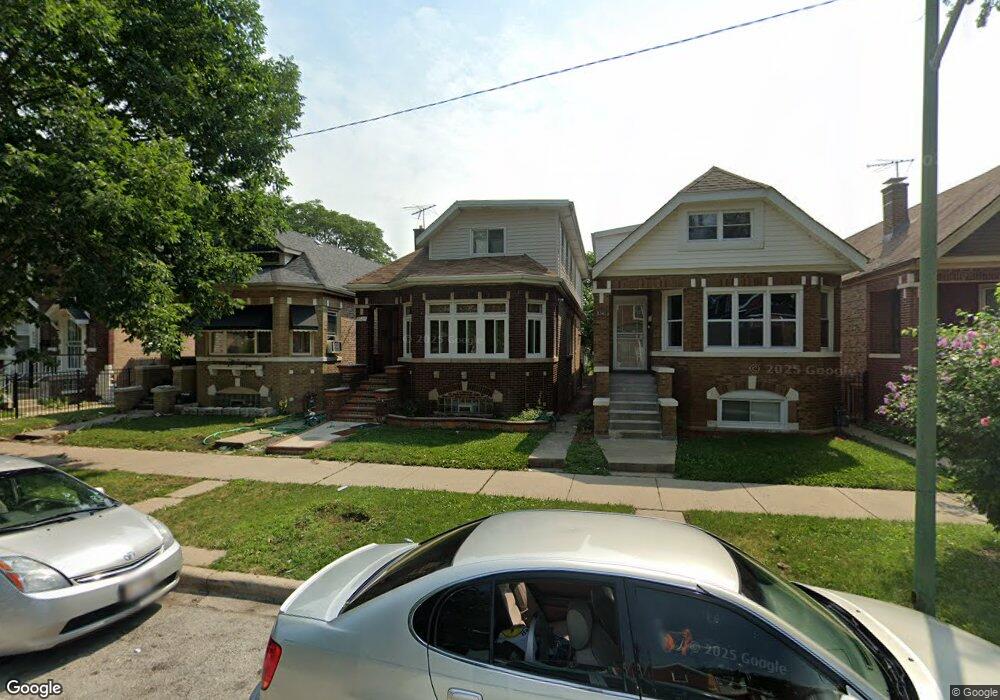
8339 S Carpenter St Chicago, IL 60620
Auburn Gresham NeighborhoodEstimated Value: $111,000 - $202,216
6
Beds
3
Baths
1,035
Sq Ft
$166/Sq Ft
Est. Value
About This Home
This home is located at 8339 S Carpenter St, Chicago, IL 60620 and is currently estimated at $171,554, approximately $165 per square foot. 8339 S Carpenter St is a home located in Cook County with nearby schools including Gresham School of Excellence, Emil G. Hirsch Metropolitan High School, and LEARN Hunter Perkins.
Ownership History
Date
Name
Owned For
Owner Type
Purchase Details
Closed on
Oct 7, 2024
Sold by
Milligan Julius
Bought by
Mcswine Latanya
Current Estimated Value
Purchase Details
Closed on
Jun 8, 2011
Sold by
Mcswine Latanya
Bought by
Milligan Julius
Home Financials for this Owner
Home Financials are based on the most recent Mortgage that was taken out on this home.
Original Mortgage
$52,631
Interest Rate
4.5%
Mortgage Type
FHA
Purchase Details
Closed on
Jun 5, 2007
Sold by
Mcswine Ivier S
Bought by
Mcswine Latanya C
Purchase Details
Closed on
Mar 29, 2002
Sold by
Donald Latanya C
Bought by
Mcswine Ivier and Mcswine Latanya C
Home Financials for this Owner
Home Financials are based on the most recent Mortgage that was taken out on this home.
Original Mortgage
$110,500
Interest Rate
9.12%
Create a Home Valuation Report for This Property
The Home Valuation Report is an in-depth analysis detailing your home's value as well as a comparison with similar homes in the area
Home Values in the Area
Average Home Value in this Area
Purchase History
| Date | Buyer | Sale Price | Title Company |
|---|---|---|---|
| Mcswine Latanya | -- | None Listed On Document | |
| Milligan Julius | $54,000 | None Available | |
| Mcswine Latanya C | -- | None Available | |
| Mcswine Ivier | -- | -- |
Source: Public Records
Mortgage History
| Date | Status | Borrower | Loan Amount |
|---|---|---|---|
| Previous Owner | Milligan Julius | $52,631 | |
| Previous Owner | Mcswine Ivier | $110,500 |
Source: Public Records
Tax History Compared to Growth
Tax History
| Year | Tax Paid | Tax Assessment Tax Assessment Total Assessment is a certain percentage of the fair market value that is determined by local assessors to be the total taxable value of land and additions on the property. | Land | Improvement |
|---|---|---|---|---|
| 2024 | $1,582 | $7,201 | $1,563 | $5,638 |
| 2023 | $1,542 | $7,500 | $2,344 | $5,156 |
| 2022 | $1,542 | $7,500 | $2,344 | $5,156 |
| 2021 | $1,508 | $7,499 | $2,343 | $5,156 |
| 2020 | $2,390 | $10,728 | $2,343 | $8,385 |
| 2019 | $2,369 | $11,790 | $2,343 | $9,447 |
| 2018 | $2,329 | $11,790 | $2,343 | $9,447 |
| 2017 | $1,966 | $9,132 | $2,031 | $7,101 |
| 2016 | $1,829 | $9,132 | $2,031 | $7,101 |
| 2015 | $1,673 | $9,132 | $2,031 | $7,101 |
| 2014 | $1,612 | $8,686 | $1,875 | $6,811 |
| 2013 | $1,580 | $8,686 | $1,875 | $6,811 |
Source: Public Records
Map
Nearby Homes
- 8412 S Carpenter St
- 8423 S Carpenter St
- 8419 S Morgan St
- 8358 S Sangamon St
- 8438 S Morgan St
- 8414 S Sangamon St
- 8307 S Morgan St
- 8254 S Morgan St
- 8318 S Peoria St
- 8440 S Peoria St
- 8521 S Carpenter St
- 8513 S Sangamon St
- 8350 S Green St
- 8211 S Morgan St
- 8508 S May St
- 8411 S Elizabeth St
- 8546 S Sangamon St
- 8548 S Aberdeen St
- 8558 S Sangamon St
- 8153 S Sangamon St
- 8337 S Carpenter St
- 8341 S Carpenter St
- 8343 S Carpenter St
- 8333 S Carpenter St
- 8347 S Carpenter St
- 8329 S Carpenter St
- 8349 S Carpenter St
- 8327 S Carpenter St
- 8338 S Morgan St
- 8353 S Carpenter St
- 8340 S Morgan St
- 8340 S Morgan St
- 8334 S Morgan St
- 8334 S Morgan St
- 8342 S Morgan St Unit 2
- 8342 S Morgan St
- 8330 S Morgan St
- 8323 S Carpenter St
- 8328 S Morgan St
- 8346 S Morgan St