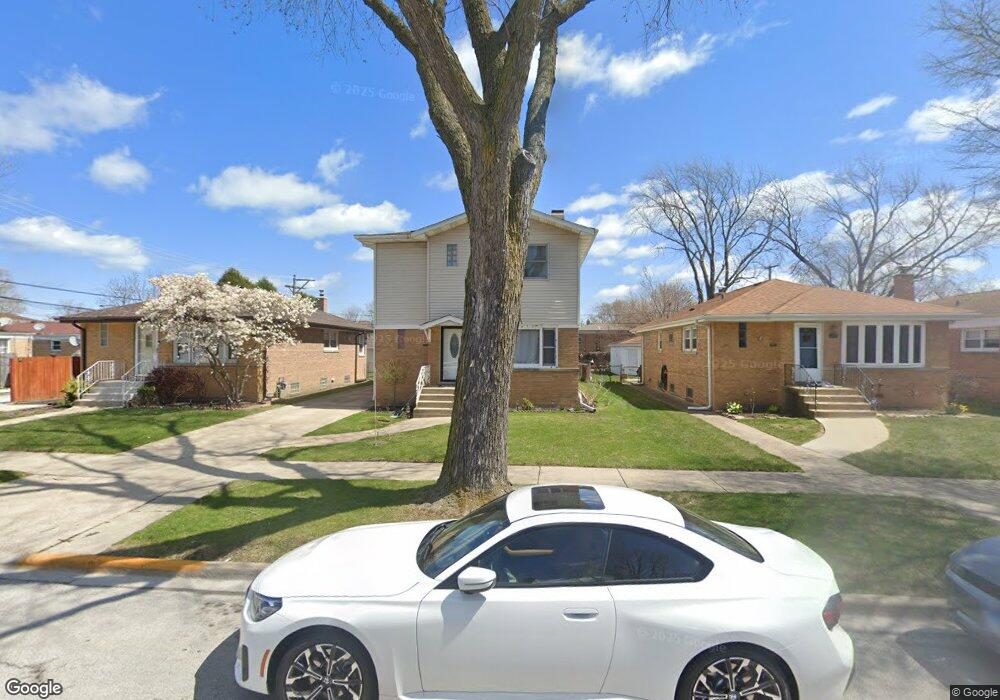
8339 Saint Louis Ave Skokie, IL 60076
Southeast Skokie NeighborhoodEstimated Value: $384,000 - $520,000
4
Beds
3
Baths
2,000
Sq Ft
$237/Sq Ft
Est. Value
About This Home
This home is located at 8339 Saint Louis Ave, Skokie, IL 60076 and is currently estimated at $474,257, approximately $237 per square foot. 8339 Saint Louis Ave is a home located in Cook County with nearby schools including Elizabeth Meyer School, John Middleton Elementary School, and Oliver Mccracken Middle School.
Ownership History
Date
Name
Owned For
Owner Type
Purchase Details
Closed on
Dec 7, 2019
Sold by
Cueva Daniela
Bought by
Cueva Karyna De Los Angeles
Current Estimated Value
Home Financials for this Owner
Home Financials are based on the most recent Mortgage that was taken out on this home.
Original Mortgage
$358,058
Outstanding Balance
$313,472
Interest Rate
3.25%
Mortgage Type
FHA
Estimated Equity
$160,785
Purchase Details
Closed on
Oct 16, 2018
Sold by
Mathew Thresiamma and Mathew Tom
Bought by
Cueva Karyna De Los Angeles and Cueva Daniela
Home Financials for this Owner
Home Financials are based on the most recent Mortgage that was taken out on this home.
Original Mortgage
$338,751
Interest Rate
5.75%
Mortgage Type
FHA
Purchase Details
Closed on
Aug 1, 2008
Sold by
Mathew Thomas and Mathew Thresiamma
Bought by
Mathew Thresiamma and Mathew Tom
Create a Home Valuation Report for This Property
The Home Valuation Report is an in-depth analysis detailing your home's value as well as a comparison with similar homes in the area
Home Values in the Area
Average Home Value in this Area
Purchase History
| Date | Buyer | Sale Price | Title Company |
|---|---|---|---|
| Cueva Karyna De Los Angeles | -- | Greater Illinois Title | |
| Cueva Karyna De Los Angeles | $345,000 | Burnet Title Post Closing | |
| Mathew Thresiamma | -- | None Available |
Source: Public Records
Mortgage History
| Date | Status | Borrower | Loan Amount |
|---|---|---|---|
| Open | Cueva Karyna De Los Angeles | $358,058 | |
| Closed | Cueva Karyna De Los Angeles | $338,751 |
Source: Public Records
Tax History Compared to Growth
Tax History
| Year | Tax Paid | Tax Assessment Tax Assessment Total Assessment is a certain percentage of the fair market value that is determined by local assessors to be the total taxable value of land and additions on the property. | Land | Improvement |
|---|---|---|---|---|
| 2024 | $9,986 | $36,000 | $6,642 | $29,358 |
| 2023 | $9,802 | $36,000 | $6,642 | $29,358 |
| 2022 | $9,802 | $36,000 | $6,642 | $29,358 |
| 2021 | $9,069 | $28,583 | $4,674 | $23,909 |
| 2020 | $8,752 | $28,583 | $4,674 | $23,909 |
| 2019 | $9,730 | $31,759 | $4,674 | $27,085 |
| 2018 | $7,671 | $27,863 | $4,059 | $23,804 |
| 2017 | $7,750 | $27,863 | $4,059 | $23,804 |
| 2016 | $7,882 | $27,863 | $4,059 | $23,804 |
| 2015 | $7,043 | $23,746 | $3,444 | $20,302 |
| 2014 | $6,922 | $23,746 | $3,444 | $20,302 |
| 2013 | $6,856 | $23,746 | $3,444 | $20,302 |
Source: Public Records
Map
Nearby Homes
- 3452 Main St
- 8415 Trumbull Ave
- 3552 Main St
- 8450 Drake Ave
- 8303 Lawndale Ave
- 8613 Trumbull Ave
- 8607 Lawndale Ave
- 8713 Drake Ave
- 3639 Crain St
- 8600 E Prairie Rd
- 8728 Trumbull Ave
- 2321 Lee St
- 930 Pitner Ave Unit 3
- 8822 Central Park Ave
- 8822 Forestview Rd
- 8231 Harding Ave
- 2213 Cleveland St
- 1112 Pitner Ave
- 1126 Pitner Ave
- 8414 Crawford Ave
- 8339 St Louis Ave
- 8345 Saint Louis Ave
- 8335 Saint Louis Ave
- 8331 Saint Louis Ave
- 8325 Saint Louis Ave
- 8338 Trumbull Ave
- 8334 Trumbull Ave
- 8342 Trumbull Ave
- 3449 Main St
- 3443 Main St
- 8323 Saint Louis Ave
- 8330 Trumbull Ave
- 8330 Trumbull Ave
- 8322 Trumbull Ave
- 3439 Main St
- 3501 Main St
- 8317 Saint Louis Ave
- 8318 Trumbull Ave
- 8350 Trumbull Ave
- 3505 Main St