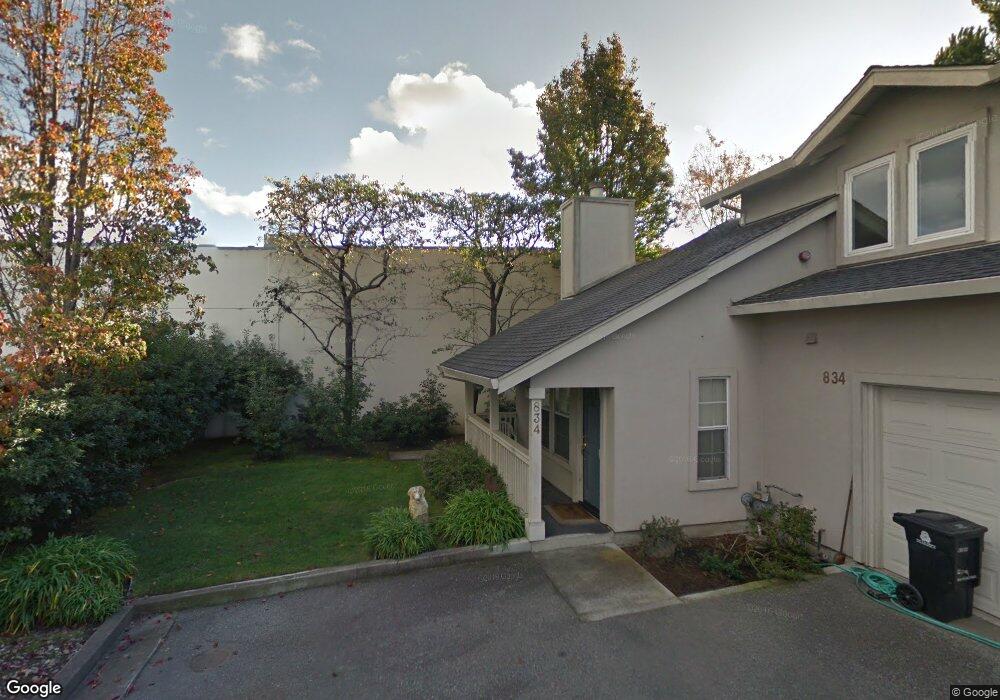
834 Excell Ct Mountain View, CA 94043
Monta Loma NeighborhoodEstimated Value: $1,227,000 - $1,452,000
3
Beds
3
Baths
1,348
Sq Ft
$1,017/Sq Ft
Est. Value
About This Home
This home is located at 834 Excell Ct, Mountain View, CA 94043 and is currently estimated at $1,370,769, approximately $1,016 per square foot. 834 Excell Ct is a home located in Santa Clara County with nearby schools including Monta Loma Elementary School, Crittenden Middle School, and Los Altos High School.
Ownership History
Date
Name
Owned For
Owner Type
Purchase Details
Closed on
Jul 9, 2003
Sold by
Chung Corinna F
Bought by
Faigenbaum Mark A
Current Estimated Value
Home Financials for this Owner
Home Financials are based on the most recent Mortgage that was taken out on this home.
Original Mortgage
$179,343
Outstanding Balance
$28,005
Interest Rate
3.12%
Mortgage Type
Stand Alone First
Estimated Equity
$1,342,764
Purchase Details
Closed on
Mar 25, 1999
Sold by
Sweeney Thomas J and Sweeney Linda J
Bought by
Faigenbaum Mark A
Home Financials for this Owner
Home Financials are based on the most recent Mortgage that was taken out on this home.
Original Mortgage
$435,600
Outstanding Balance
$109,938
Interest Rate
7.25%
Estimated Equity
$1,260,831
Purchase Details
Closed on
Dec 29, 1998
Sold by
Century Development Co Llc
Bought by
Sweeney Thomas J and Sweeney Linda J
Home Financials for this Owner
Home Financials are based on the most recent Mortgage that was taken out on this home.
Original Mortgage
$275,000
Interest Rate
5.4%
Create a Home Valuation Report for This Property
The Home Valuation Report is an in-depth analysis detailing your home's value as well as a comparison with similar homes in the area
Home Values in the Area
Average Home Value in this Area
Purchase History
| Date | Buyer | Sale Price | Title Company |
|---|---|---|---|
| Faigenbaum Mark A | -- | First American Title Co | |
| Faigenbaum Mark A | $440,000 | American Title Co | |
| Sweeney Thomas J | $425,000 | Alliance Title Company |
Source: Public Records
Mortgage History
| Date | Status | Borrower | Loan Amount |
|---|---|---|---|
| Open | Faigenbaum Mark A | $179,343 | |
| Open | Faigenbaum Mark A | $435,600 | |
| Previous Owner | Sweeney Thomas J | $275,000 |
Source: Public Records
Tax History
| Year | Tax Paid | Tax Assessment Tax Assessment Total Assessment is a certain percentage of the fair market value that is determined by local assessors to be the total taxable value of land and additions on the property. | Land | Improvement |
|---|---|---|---|---|
| 2025 | $8,052 | $689,777 | $470,304 | $219,473 |
| 2024 | $8,052 | $676,253 | $461,083 | $215,170 |
| 2023 | $7,944 | $662,994 | $452,043 | $210,951 |
| 2022 | $7,920 | $649,995 | $443,180 | $206,815 |
| 2021 | $7,730 | $637,251 | $434,491 | $202,760 |
| 2020 | $7,683 | $630,717 | $430,036 | $200,681 |
| 2019 | $7,340 | $618,351 | $421,604 | $196,747 |
| 2018 | $7,276 | $606,228 | $413,338 | $192,890 |
| 2017 | $6,941 | $594,342 | $405,234 | $189,108 |
| 2016 | $6,780 | $582,689 | $397,289 | $185,400 |
| 2015 | $6,605 | $573,938 | $391,322 | $182,616 |
| 2014 | $6,523 | $562,696 | $383,657 | $179,039 |
Source: Public Records
Map
Nearby Homes
- 837 Sierra Vista Ave
- 853B Sierra Vista Ave
- 2041 Atlas Loop
- 2045 Atlas Loop
- 2061 Colony St
- 1951 Plymouth St
- 888 N Rengstorff Ave
- 2219 Woodberry Ln
- 453 N Rengstorff Ave Unit 17
- 2020 Thea Cir
- 2574 Alvin St
- 1972 Montecito Ave
- 311 Marquetta Cir
- 290 N Rengstorff Ave
- 2047 Montecito Ave Unit 2
- 670 San Antonio Rd Unit 26
- 1972 Sage Loop
- 1861 Montecito Ave
- 348 Nita Ave
- 444 San Antonio Rd Unit 12B
- 836 Excell Ct
- 1979 Colony St
- 1987 Colony St
- 828 Sierra Vista Ave
- 1983 Colony St
- 836 Sierra Vista Ave
- 1975 Colony St
- 1991 Colony St Unit Middle
- 1991 Colony St Unit 2
- 1991 Colony St
- 1968 Colony St
- 1962 Colony St
- 2001 Colony St
- 1976 Colony St
- 841 Sierra Vista Ave
- 847 Sierra Vista Ave Unit 13
- 845 Sierra Vista Ave
- 1972 Colony St
- 1971 Colony St
- 1978 Colony St