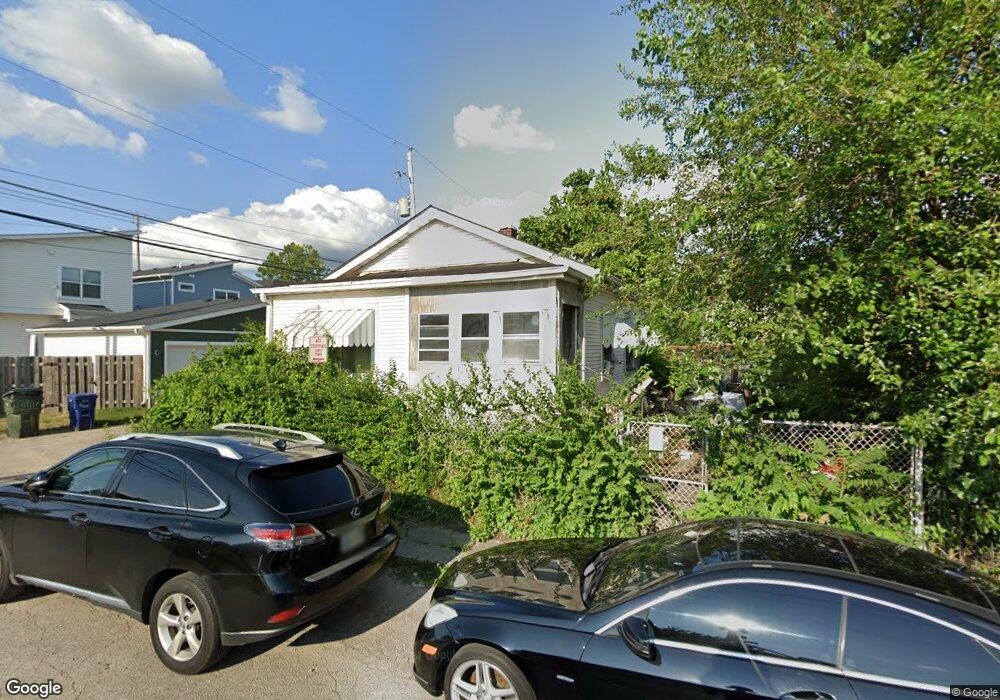
834 N 9th St Columbus, OH 43201
Milo-Grogan NeighborhoodEstimated Value: $66,338 - $146,000
1
Bed
1
Bath
566
Sq Ft
$198/Sq Ft
Est. Value
About This Home
This home is located at 834 N 9th St, Columbus, OH 43201 and is currently estimated at $112,085, approximately $198 per square foot. 834 N 9th St is a home located in Franklin County with nearby schools including Weinland Park Elementary School, Dominion Middle School, and Whetstone High School.
Ownership History
Date
Name
Owned For
Owner Type
Purchase Details
Closed on
Jun 10, 2024
Sold by
Chandler Hig Velocity Fund Llc
Bought by
Fulghum Ramona L
Current Estimated Value
Purchase Details
Closed on
Aug 16, 2023
Sold by
Dsk Investments Inc
Bought by
Chandler Hig Velocity Fund Llc
Purchase Details
Closed on
Jul 12, 2023
Sold by
Dsk Investments Inc
Bought by
Chandler Hig Velocity Fund Llc
Purchase Details
Closed on
Nov 21, 2021
Sold by
Super Sullivant Brothers Llc
Bought by
Ds & K Investments Llc
Purchase Details
Closed on
Nov 3, 2021
Sold by
Ds & K Investments Llc
Bought by
Fulghum Ramona L
Purchase Details
Closed on
Nov 2, 2021
Sold by
Super Sullivant Brothers Llc
Bought by
Dsk Investments Inc
Purchase Details
Closed on
Nov 1, 2021
Sold by
Ds & K Investments Llc
Bought by
Fulghum Ramona L
Purchase Details
Closed on
Sep 30, 2021
Sold by
Ds & K Investments Llc
Bought by
Super Sullivant Brothers Llc
Purchase Details
Closed on
Sep 28, 2021
Sold by
Dsk Investments Inc
Bought by
Super Sullivant Brothers Llc
Purchase Details
Closed on
Jul 10, 2017
Sold by
Pettis Morris C
Bought by
Ds K Investments Llc
Purchase Details
Closed on
Jul 31, 1997
Sold by
Milner Bernice
Bought by
Pettis Morris C and Pettis Bernice
Create a Home Valuation Report for This Property
The Home Valuation Report is an in-depth analysis detailing your home's value as well as a comparison with similar homes in the area
Home Values in the Area
Average Home Value in this Area
Purchase History
| Date | Buyer | Sale Price | Title Company |
|---|---|---|---|
| Fulghum Ramona L | $18,275 | Allied Servicing | |
| Chandler Hig Velocity Fund Llc | $5,485 | None Listed On Document | |
| Chandler Hig Velocity Fund Llc | $5,485 | None Listed On Document | |
| Ds & K Investments Llc | $30,000 | Apex Title Agency Ltd | |
| Fulghum Ramona L | -- | -- | |
| Dsk Investments Inc | $30,000 | Apex Title | |
| Fulghum Ramona L | -- | Apex Title Agency Ltd | |
| Super Sullivant Brothers Llc | $25,000 | Apex Title Agency Ltd | |
| Super Sullivant Brothers Llc | $25,000 | Apex Title | |
| Ds K Investments Llc | $18,000 | None Available | |
| Pettis Morris C | -- | -- |
Source: Public Records
Mortgage History
| Date | Status | Borrower | Loan Amount |
|---|---|---|---|
| Closed | Fulghum Ramona L | $0 |
Source: Public Records
Tax History Compared to Growth
Tax History
| Year | Tax Paid | Tax Assessment Tax Assessment Total Assessment is a certain percentage of the fair market value that is determined by local assessors to be the total taxable value of land and additions on the property. | Land | Improvement |
|---|---|---|---|---|
| 2024 | $3,044 | $33,220 | $12,850 | $20,370 |
| 2023 | $1,713 | $33,220 | $12,850 | $20,370 |
| 2022 | $2,291 | $20,690 | $2,840 | $17,850 |
| 2021 | $1,102 | $20,690 | $2,840 | $17,850 |
| 2020 | $1,103 | $20,690 | $2,840 | $17,850 |
| 2019 | $1,217 | $17,960 | $2,450 | $15,510 |
| 2018 | $735 | $17,960 | $2,450 | $15,510 |
| 2017 | $1,289 | $17,960 | $2,450 | $15,510 |
| 2016 | $2,809 | $9,910 | $1,540 | $8,370 |
| 2015 | $183 | $9,910 | $1,540 | $8,370 |
| 2014 | $70 | $9,910 | $1,540 | $8,370 |
| 2013 | $807 | $10,430 | $1,610 | $8,820 |
Source: Public Records
Map
Nearby Homes
- 570 Reynolds Ave
- 574 Reynolds Ave Unit 6
- 773-775 E 3rd Ave
- 790-792 E Starr Ave
- 779 Gibbard Ave
- 0 E 4th Ave
- 276 E 4th Ave
- 810-812 E 3rd Ave
- 780-782 Gibbard Ave
- 796 Gibbard Ave
- 1025 Howard St
- 997-999 Gibbard Ave
- 841 Saint Clair Ave
- 367 Auden Ave Unit 302
- 367 Auden Ave Unit 210
- 367 Auden Ave Unit 213
- 318 Cornelius St Unit 6
- 719 Civitas Ave Unit 401
- 309 Auden Ave
- 304 Cornelius St
- 624 Reynolds Ave
- 620 Reynolds Ave
- 628 Reynolds Ave
- 610 Reynolds Ave
- 632 Reynolds Ave
- 627 E 2nd Ave
- 606 Reynolds Ave
- 631 E 2nd Ave
- 635 E 2nd Ave
- 615 E 2nd Ave
- 636 Reynolds Ave
- 639 E 2nd Ave Unit 639
- 611 E 2nd Ave
- 640 Reynolds Ave
- 600 Reynolds Ave
- 641 E 2nd Ave
- 607 E 2nd Ave
- 644 Reynolds Ave
- 601 E 2nd Ave
- 648 Reynolds Ave