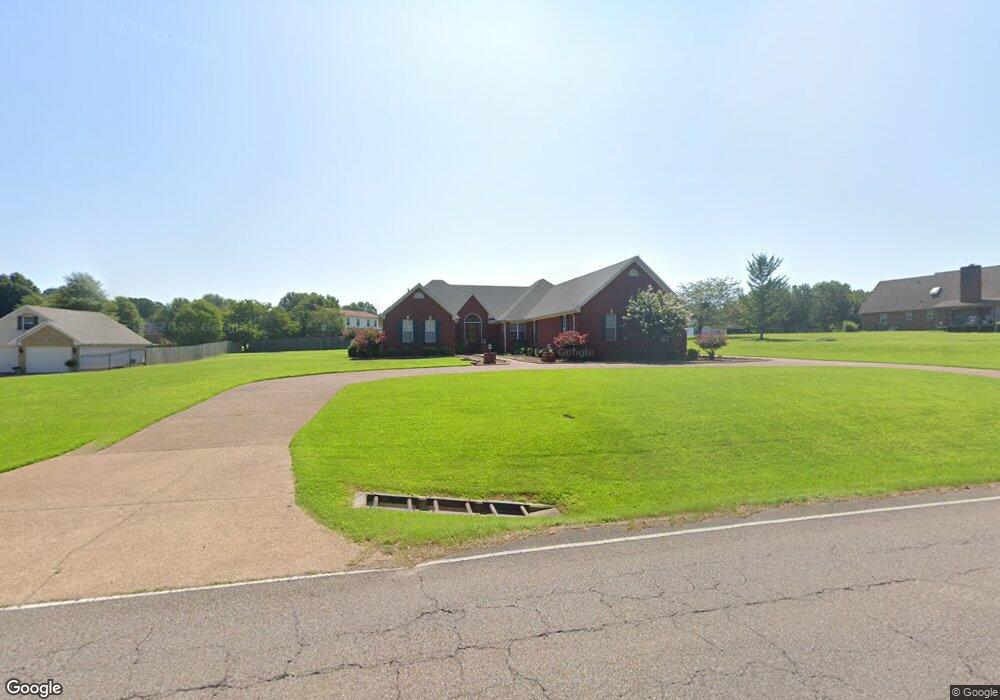
834 Pipkin Rd Jackson, TN 38305
Estimated Value: $356,000 - $528,000
Studio
3
Baths
2,750
Sq Ft
$158/Sq Ft
Est. Value
About This Home
This home is located at 834 Pipkin Rd, Jackson, TN 38305 and is currently estimated at $434,347, approximately $157 per square foot. 834 Pipkin Rd is a home located in Madison County with nearby schools including Pope School, Northeast Middle School, and North Side High School.
Ownership History
Date
Name
Owned For
Owner Type
Purchase Details
Closed on
May 18, 2021
Sold by
Sipes Bryndel
Bought by
Sipes David Lynn and Taylor Tammy
Current Estimated Value
Purchase Details
Closed on
Sep 9, 2005
Sold by
First Tennessee Bank
Bought by
Etal Davidson Albert
Home Financials for this Owner
Home Financials are based on the most recent Mortgage that was taken out on this home.
Original Mortgage
$110,000
Outstanding Balance
$57,464
Interest Rate
5.77%
Estimated Equity
$376,883
Purchase Details
Closed on
Feb 13, 1998
Sold by
Fuller Const Co
Bought by
Parimore Stephen E
Purchase Details
Closed on
Nov 15, 1996
Bought by
Fuller Const Co
Purchase Details
Closed on
Dec 28, 1988
Bought by
Scott Jonathan L
Purchase Details
Closed on
Oct 10, 1980
Bought by
White Edith S
Create a Home Valuation Report for This Property
The Home Valuation Report is an in-depth analysis detailing your home's value as well as a comparison with similar homes in the area
Purchase History
| Date | Buyer | Sale Price | Title Company |
|---|---|---|---|
| Sipes David Lynn | -- | None Available | |
| Etal Davidson Albert | $192,500 | -- | |
| Parimore Stephen E | $128,891 | -- | |
| Fuller Const Co | $14,500 | -- | |
| Scott Jonathan L | $14,500 | -- | |
| White Edith S | -- | -- |
Source: Public Records
Mortgage History
| Date | Status | Borrower | Loan Amount |
|---|---|---|---|
| Open | White Edith S | $110,000 |
Source: Public Records
Tax History
| Year | Tax Paid | Tax Assessment Tax Assessment Total Assessment is a certain percentage of the fair market value that is determined by local assessors to be the total taxable value of land and additions on the property. | Land | Improvement |
|---|---|---|---|---|
| 2025 | $1,616 | $86,225 | $13,750 | $72,475 |
| 2024 | $1,616 | $86,225 | $13,750 | $72,475 |
| 2022 | $3,005 | $86,225 | $13,750 | $72,475 |
| 2021 | $2,736 | $63,450 | $6,700 | $56,750 |
| 2020 | $2,736 | $63,450 | $6,700 | $56,750 |
| 2019 | $2,736 | $63,450 | $6,700 | $56,750 |
| 2018 | $2,736 | $63,450 | $6,700 | $56,750 |
| 2017 | $2,672 | $60,575 | $6,700 | $53,875 |
| 2016 | $2,490 | $60,575 | $6,700 | $53,875 |
| 2015 | $2,491 | $60,575 | $6,700 | $53,875 |
| 2014 | $2,496 | $60,700 | $6,700 | $54,000 |
Source: Public Records
Map
Nearby Homes
- 33 Summerfield Dr
- 22 Deepwood Dr
- 50 Windfield Cove
- 100 Crest Ridge Dr
- 26 Bridlepath Dr
- 38 Bridlepath Dr
- 35 Hampstead Cove
- 85 Weatheridge Dr
- 669 Walker Rd
- 9 Windwood Dr
- 119 Stonehenge Dr
- 465 Shadow Ridge Dr
- 4 Windwood Dr
- 7 Northwind Dr
- 2949 Highway 45 Bypass Frontage Rd
- 208 Murray Guard Dr
- 224 Murray Guard Dr
- 11 Deer Pointe
- 198 Murray Guard Dr
- 178 Murray Guard Dr
- 850 Pipkin Rd
- 38 Summerset Cove
- 818 Pipkin Rd
- 812 Pipkin Rd
- 33 White Oaks Dr
- 833 Pipkin Rd
- 801 Pipkin Rd
- 24 Summerset Cove
- 870 Pipkin Rd
- 27 Summerset Cove
- 49 White Oaks Dr
- 381 Wellington Cove
- 894 Pipkin Rd
- 36 White Oaks Dr
- 369 Wellington Cove
- 53 Driftwood Dr
- 391 Wellington Cove
- 808 Pipkin Rd
- 75 Driftwood Dr
- 914 Pipkin Rd
Your Personal Tour Guide
Ask me questions while you tour the home.