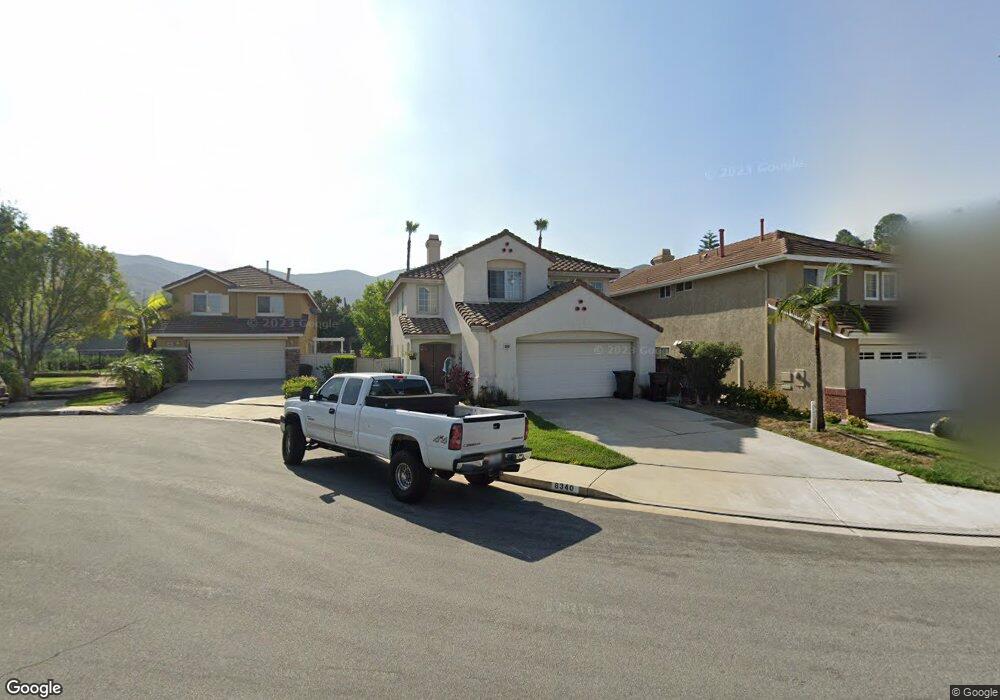
8340 E Starcrest Ct Anaheim, CA 92808
Anaheim Hills NeighborhoodEstimated Value: $1,207,433 - $1,267,000
4
Beds
3
Baths
2,013
Sq Ft
$615/Sq Ft
Est. Value
About This Home
This home is located at 8340 E Starcrest Ct, Anaheim, CA 92808 and is currently estimated at $1,238,858, approximately $615 per square foot. 8340 E Starcrest Ct is a home located in Orange County with nearby schools including Running Springs Elementary, Canyon High School, and El Rancho Charter.
Ownership History
Date
Name
Owned For
Owner Type
Purchase Details
Closed on
Dec 3, 2019
Sold by
Madsen Gregory and Madsen Gregory
Bought by
Madsen Gregory and The Gregory W Madsen Trust
Current Estimated Value
Purchase Details
Closed on
Jul 19, 2017
Sold by
Murrieta Sonia
Bought by
Madsen Gregory
Home Financials for this Owner
Home Financials are based on the most recent Mortgage that was taken out on this home.
Original Mortgage
$540,000
Outstanding Balance
$448,895
Interest Rate
3.91%
Mortgage Type
New Conventional
Estimated Equity
$789,963
Purchase Details
Closed on
Jan 12, 2012
Sold by
Madsen Gregory and Murrietta Sonia
Bought by
Madsen Gregory and Murrietta Sonia
Home Financials for this Owner
Home Financials are based on the most recent Mortgage that was taken out on this home.
Original Mortgage
$360,000
Interest Rate
3.93%
Mortgage Type
New Conventional
Purchase Details
Closed on
Mar 5, 2003
Sold by
Fisher Duane R and Fisher Karen D
Bought by
Madsen Gregory and Murrietta Sonia
Home Financials for this Owner
Home Financials are based on the most recent Mortgage that was taken out on this home.
Original Mortgage
$377,600
Interest Rate
5%
Create a Home Valuation Report for This Property
The Home Valuation Report is an in-depth analysis detailing your home's value as well as a comparison with similar homes in the area
Home Values in the Area
Average Home Value in this Area
Purchase History
| Date | Buyer | Sale Price | Title Company |
|---|---|---|---|
| Madsen Gregory | -- | None Available | |
| Madsen Gregory | -- | Wfg Lender Services | |
| Madsen Gregory | -- | Lsi | |
| Madsen Gregory | $472,000 | Landwood Title Company |
Source: Public Records
Mortgage History
| Date | Status | Borrower | Loan Amount |
|---|---|---|---|
| Open | Madsen Gregory | $540,000 | |
| Closed | Madsen Gregory | $360,000 | |
| Previous Owner | Madsen Gregory | $377,600 | |
| Closed | Madsen Gregory | $47,200 |
Source: Public Records
Tax History
| Year | Tax Paid | Tax Assessment Tax Assessment Total Assessment is a certain percentage of the fair market value that is determined by local assessors to be the total taxable value of land and additions on the property. | Land | Improvement |
|---|---|---|---|---|
| 2025 | $7,403 | $683,605 | $407,920 | $275,685 |
| 2024 | $7,403 | $670,201 | $399,921 | $270,280 |
| 2023 | $7,238 | $657,060 | $392,079 | $264,981 |
| 2022 | $7,097 | $644,177 | $384,391 | $259,786 |
| 2021 | $6,898 | $631,547 | $376,854 | $254,693 |
| 2020 | $6,833 | $625,072 | $372,990 | $252,082 |
| 2019 | $6,746 | $612,816 | $365,676 | $247,140 |
| 2018 | $6,716 | $600,800 | $358,505 | $242,295 |
| 2017 | $6,364 | $589,020 | $351,475 | $237,545 |
| 2016 | $6,240 | $577,471 | $344,583 | $232,888 |
| 2015 | $6,123 | $568,797 | $339,407 | $229,390 |
| 2014 | $6,027 | $557,656 | $332,759 | $224,897 |
Source: Public Records
Map
Nearby Homes
- 1232 S Country Glen Way
- 1358 S Country Glen Way Unit D
- 8346 E Quiet Canyon Ct
- 8176 E Bailey Way
- 8750 E Heatherwood Rd
- 8830 E Wiley Way Unit 20
- 8109 E Bailey Way
- 8142 E Naples Ln
- 910 S Barton Ct
- 1099 S San Marino Way
- 8027 E Naples Ln
- 8047 E Sandstone Dr
- 7877 E Horizon View Dr
- 1053 S Daybreak Ct
- 547 S Eveningsong Ln
- 7835 E Viewrim Dr
- 7912 E Monte Carlo Ave
- 7904 E Monte Carlo Ave Unit 199
- 518 S Laureltree Dr
- 927 S Firefly Dr
- 8330 E Starcrest Ct
- 8350 E Starcrest Ct
- 8320 E Starcrest Ct
- 1152 S Silver Star Way
- 1160 S Silver Star Way
- 8300 E Starcrest Ct
- 1168 S Silver Star Way
- 8361 E Starcrest Ct
- 8341 E Starcrest Ct
- 8351 E Starcrest Ct
- 1176 S Silver Star Way
- 8331 E Starcrest Ct
- 8321 E Starcrest Ct
- 8311 E Starcrest Ct
- 8301 E Starcrest Ct
- 1184 S Silver Star Way
- 1143 S Silver Star Way
- 1151 S Silver Star Way
- 1135 S Silver Star Way
- 1159 S Silver Star Way
Your Personal Tour Guide
Ask me questions while you tour the home.