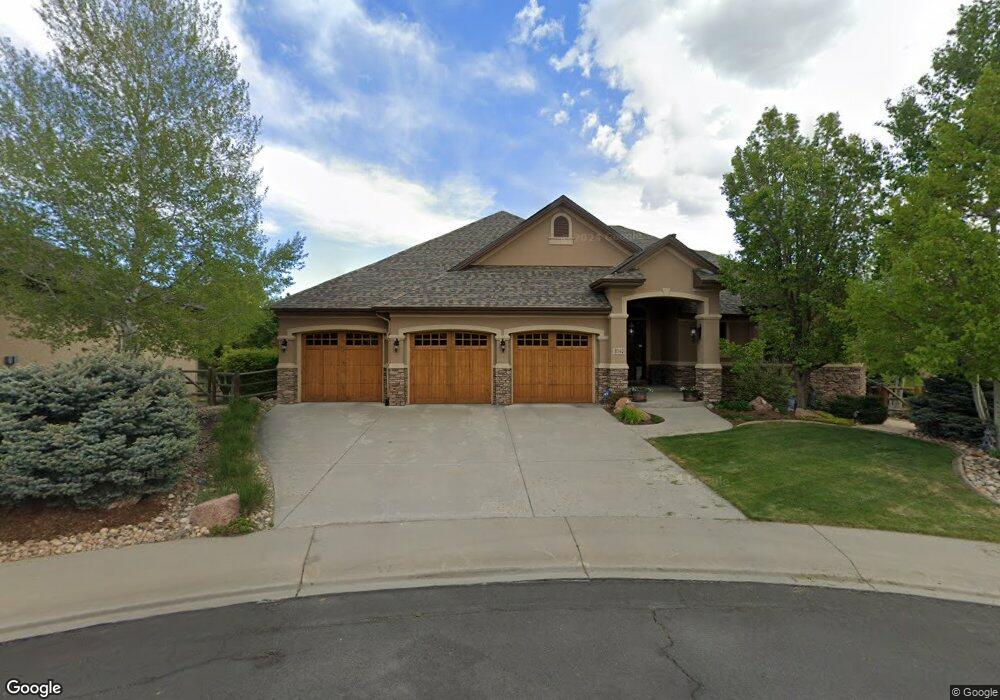
8340 Wynstone Ct Windsor, CO 80550
Estimated Value: $1,050,780 - $1,179,000
2
Beds
4
Baths
4,151
Sq Ft
$272/Sq Ft
Est. Value
About This Home
This home is located at 8340 Wynstone Ct, Windsor, CO 80550 and is currently estimated at $1,130,445, approximately $272 per square foot. 8340 Wynstone Ct is a home located in Larimer County with nearby schools including High Plains School and Mountain View High School.
Ownership History
Date
Name
Owned For
Owner Type
Purchase Details
Closed on
Apr 20, 2011
Sold by
Davis Larry A and Davis Diane G
Bought by
Payne Stephen W and Payne Lisa R
Current Estimated Value
Home Financials for this Owner
Home Financials are based on the most recent Mortgage that was taken out on this home.
Original Mortgage
$460,000
Outstanding Balance
$318,986
Interest Rate
4.91%
Mortgage Type
New Conventional
Estimated Equity
$811,459
Purchase Details
Closed on
Apr 18, 2007
Sold by
Province Inc
Bought by
Davis Larry A and Davis Diane G
Home Financials for this Owner
Home Financials are based on the most recent Mortgage that was taken out on this home.
Original Mortgage
$200,000
Interest Rate
6.15%
Mortgage Type
Purchase Money Mortgage
Purchase Details
Closed on
Oct 10, 2006
Sold by
Highpoint Vista Llc
Bought by
Province Inc
Create a Home Valuation Report for This Property
The Home Valuation Report is an in-depth analysis detailing your home's value as well as a comparison with similar homes in the area
Home Values in the Area
Average Home Value in this Area
Purchase History
| Date | Buyer | Sale Price | Title Company |
|---|---|---|---|
| Payne Stephen W | $695,000 | Tggt | |
| Davis Larry A | $694,912 | Land Title | |
| Province Inc | $90,000 | None Available | |
| Highpoint Vista Llc | -- | None Available |
Source: Public Records
Mortgage History
| Date | Status | Borrower | Loan Amount |
|---|---|---|---|
| Open | Payne Stephen W | $460,000 | |
| Previous Owner | Davis Larry A | $200,000 |
Source: Public Records
Tax History Compared to Growth
Tax History
| Year | Tax Paid | Tax Assessment Tax Assessment Total Assessment is a certain percentage of the fair market value that is determined by local assessors to be the total taxable value of land and additions on the property. | Land | Improvement |
|---|---|---|---|---|
| 2025 | $8,532 | $68,280 | $15,745 | $52,535 |
| 2024 | $8,333 | $68,280 | $15,745 | $52,535 |
| 2022 | $6,770 | $51,194 | $13,226 | $37,968 |
| 2021 | $6,885 | $52,666 | $13,606 | $39,060 |
| 2020 | $7,284 | $55,677 | $11,726 | $43,951 |
| 2019 | $7,207 | $55,677 | $11,726 | $43,951 |
| 2018 | $6,244 | $46,944 | $8,856 | $38,088 |
| 2017 | $5,715 | $46,944 | $8,856 | $38,088 |
| 2016 | $5,924 | $49,153 | $6,527 | $42,626 |
| 2015 | $5,870 | $49,160 | $6,530 | $42,630 |
| 2014 | $5,899 | $48,150 | $4,620 | $43,530 |
Source: Public Records
Map
Nearby Homes
- 8181 Wynstone Dr
- 8736 Blackwood Dr
- 7845 Blackwood Dr
- 5830 Last Pointe Dr
- 2003 Kaplan Dr
- 1813 Garden Flourish Ct
- 1949 Kaplan Dr
- 1649 Rise Dr
- 1725 Country Sun Dr
- 1722 Branching Canopy Dr
- 1591 Landon Ct
- The Broadmoor Plan at The Fairways at RainDance
- The Isleworth Plan at The Fairways at RainDance
- Plan 4 at Festival at RainDance
- Plan 6 at Festival at RainDance
- Plan 3 at Festival at RainDance
- Plan 5 at Festival at RainDance
- Plan 2 at Festival at RainDance
- Plan 1 at Festival at RainDance
- 1443 Folsum Dr
- 8320 Wynstone Ct
- 8361 Wynstone Ct
- 8300 Wynstone Ct
- 8305 Blackwood Dr
- 8325 Blackwood Dr
- 8321 Wynstone Ct
- 8345 Blackwood Dr
- 8285 Blackwood Dr
- 8301 Wynstone Ct
- 8280 Wynstone Ct
- 8245 Blackwood Dr
- 8415 Blackwood Dr
- 8425 Blackwood Dr
- 8225 Blackwood Dr
- 8435 Blackwood Dr
- 8260 Wynstone Ct
- 8261 Wynstone Ct
- 6103 Nearview Ct
- 8205 Blackwood Dr
- 6104 Nearview Ct