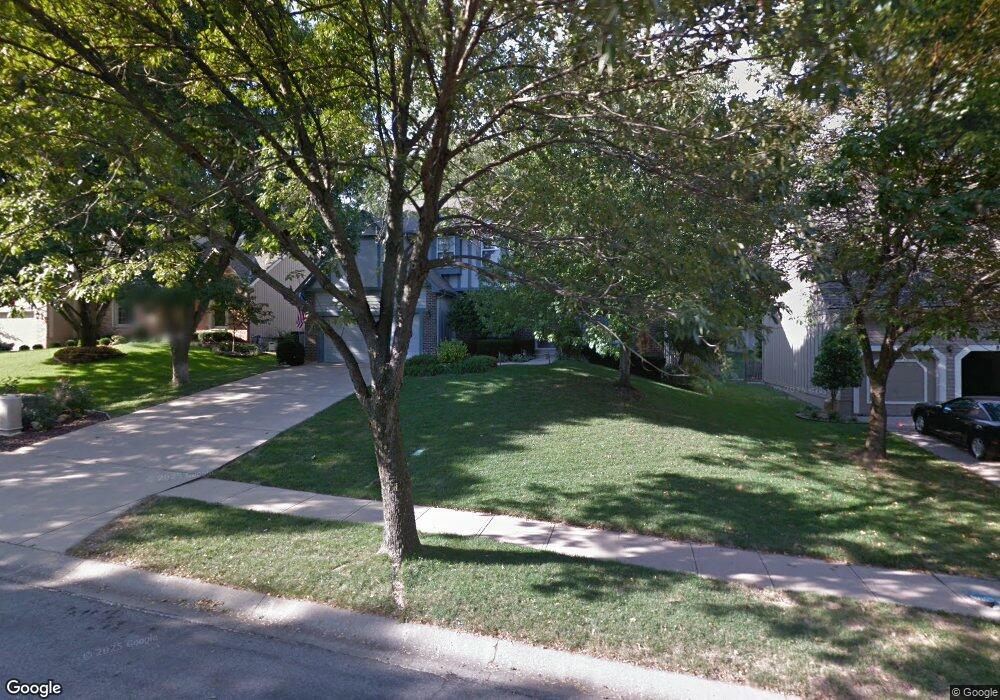
8342 Oakview Cir Lenexa, KS 66215
Estimated Value: $436,416 - $465,000
4
Beds
3
Baths
2,312
Sq Ft
$196/Sq Ft
Est. Value
About This Home
This home is located at 8342 Oakview Cir, Lenexa, KS 66215 and is currently estimated at $452,104, approximately $195 per square foot. 8342 Oakview Cir is a home located in Johnson County with nearby schools including Rising Star Elementary School, Westridge Middle School, and Shawnee Mission West High School.
Ownership History
Date
Name
Owned For
Owner Type
Purchase Details
Closed on
Jan 15, 2008
Sold by
White Katherine D and White James I
Bought by
Lucht Shelley W
Current Estimated Value
Home Financials for this Owner
Home Financials are based on the most recent Mortgage that was taken out on this home.
Original Mortgage
$217,000
Outstanding Balance
$132,888
Interest Rate
5.94%
Mortgage Type
New Conventional
Estimated Equity
$319,216
Purchase Details
Closed on
Mar 26, 2004
Sold by
White Katherine D and White James
Bought by
White James and White Katherine D
Home Financials for this Owner
Home Financials are based on the most recent Mortgage that was taken out on this home.
Original Mortgage
$150,500
Interest Rate
4.87%
Mortgage Type
New Conventional
Purchase Details
Closed on
May 29, 2002
Sold by
Volker Martin G and Volker Peggy L
Bought by
Duboc Katherine
Home Financials for this Owner
Home Financials are based on the most recent Mortgage that was taken out on this home.
Original Mortgage
$150,000
Interest Rate
6.89%
Create a Home Valuation Report for This Property
The Home Valuation Report is an in-depth analysis detailing your home's value as well as a comparison with similar homes in the area
Home Values in the Area
Average Home Value in this Area
Purchase History
| Date | Buyer | Sale Price | Title Company |
|---|---|---|---|
| Lucht Shelley W | -- | Kansas City Title | |
| White James | -- | Chicago Title Insurance Comp | |
| Duboc Katherine | -- | Old Republic Title Company |
Source: Public Records
Mortgage History
| Date | Status | Borrower | Loan Amount |
|---|---|---|---|
| Open | Lucht Shelley W | $217,000 | |
| Previous Owner | White James | $150,500 | |
| Previous Owner | Duboc Katherine | $150,000 |
Source: Public Records
Tax History
| Year | Tax Paid | Tax Assessment Tax Assessment Total Assessment is a certain percentage of the fair market value that is determined by local assessors to be the total taxable value of land and additions on the property. | Land | Improvement |
|---|---|---|---|---|
| 2025 | $4,852 | $47,852 | $10,166 | $37,686 |
| 2023 | $4,654 | $41,343 | $7,704 | $33,639 |
| 2022 | $4,343 | $38,548 | $7,001 | $31,547 |
| 2021 | $4,063 | $34,201 | $6,365 | $27,836 |
| 2020 | $3,790 | $31,567 | $6,365 | $25,202 |
| 2019 | $3,663 | $30,486 | $5,307 | $25,179 |
| 2018 | $3,834 | $31,659 | $5,307 | $26,352 |
| 2017 | $3,543 | $28,325 | $4,828 | $23,497 |
| 2016 | $3,335 | $26,312 | $4,392 | $21,920 |
| 2015 | $3,291 | $26,151 | $4,392 | $21,759 |
| 2013 | -- | $23,529 | $4,392 | $19,137 |
Source: Public Records
Map
Nearby Homes
- 8362 Oakview Cir
- 8443 Alden St
- 14828 W 83rd Place
- 8041 Acuff Ln
- 8403 Swarner Dr
- 8645 Greenwood Ln
- 15318 W 80th Place
- 7908 Park St
- 8740 Park St
- 7736 Darnell St
- 8033 Hall St
- 13212 W 84th St
- 14640 W 90th St
- 8914 Country Hill Ct
- 13204 W 85th Ct
- 13403 W 78th Place
- 9029 Acuff Ln
- 15514 W 89th St
- 13408 W 78th Terrace
- 14900 W 91st Terrace
- 8340 Oakview Cir
- 8344 Oakview Cir
- 14507 W 83rd Place
- 8338 Oakview Cir
- 14401 W 83rd Place
- 8341 Oakview Cir
- 8339 Oakview Cir
- 8349 Oakview Cir
- 14505 W 83rd Place
- 14509 W 83rd Place
- 14405 W 83rd Place
- 8336 Oakview Cir
- 8335 Oakview Cir
- 8348 Oakview Cir
- 14325 W 83rd Place
- 8350 Oakview Cir
- 8355 Oakview Cir
- 8334 Oakview Cir
- 14511 W 83rd Place
- 8352 Oakview Cir
Your Personal Tour Guide
Ask me questions while you tour the home.