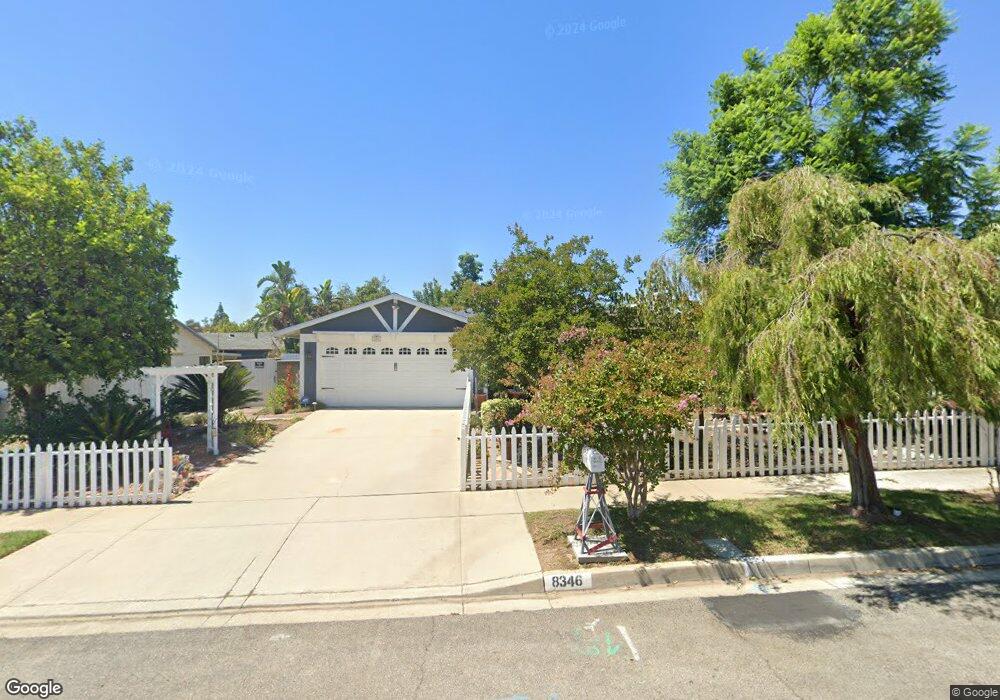
8346 Montara Ave Rancho Cucamonga, CA 91730
Estimated Value: $682,317 - $718,000
3
Beds
2
Baths
1,364
Sq Ft
$515/Sq Ft
Est. Value
About This Home
This home is located at 8346 Montara Ave, Rancho Cucamonga, CA 91730 and is currently estimated at $702,329, approximately $514 per square foot. 8346 Montara Ave is a home located in San Bernardino County with nearby schools including Bear Gulch Elementary, Cucamonga Middle, and Alta Loma High.
Ownership History
Date
Name
Owned For
Owner Type
Purchase Details
Closed on
Jun 29, 2017
Sold by
Davis Nancy A
Bought by
Davis Nancy Ann and The Nancy Ann Davis & Toby Fam
Current Estimated Value
Purchase Details
Closed on
Apr 30, 2001
Sold by
Alvarez Jesse A
Bought by
Davis Jeffrey S and Davis Nancy A
Home Financials for this Owner
Home Financials are based on the most recent Mortgage that was taken out on this home.
Original Mortgage
$170,900
Outstanding Balance
$64,333
Interest Rate
7.14%
Estimated Equity
$637,996
Purchase Details
Closed on
Apr 18, 1994
Sold by
Power Edward Bernard
Bought by
Alvarez Jesse A and Gonzales Soleta M
Home Financials for this Owner
Home Financials are based on the most recent Mortgage that was taken out on this home.
Original Mortgage
$105,600
Interest Rate
7.25%
Create a Home Valuation Report for This Property
The Home Valuation Report is an in-depth analysis detailing your home's value as well as a comparison with similar homes in the area
Home Values in the Area
Average Home Value in this Area
Purchase History
| Date | Buyer | Sale Price | Title Company |
|---|---|---|---|
| Davis Nancy Ann | -- | None Available | |
| Davis Jeffrey S | $180,000 | First American Title | |
| Alvarez Jesse A | $132,000 | First American Title Ins Co |
Source: Public Records
Mortgage History
| Date | Status | Borrower | Loan Amount |
|---|---|---|---|
| Open | Davis Jeffrey S | $170,900 | |
| Previous Owner | Alvarez Jesse A | $105,600 |
Source: Public Records
Tax History Compared to Growth
Tax History
| Year | Tax Paid | Tax Assessment Tax Assessment Total Assessment is a certain percentage of the fair market value that is determined by local assessors to be the total taxable value of land and additions on the property. | Land | Improvement |
|---|---|---|---|---|
| 2025 | $2,968 | $271,084 | $94,878 | $176,206 |
| 2024 | $2,968 | $265,769 | $93,018 | $172,751 |
| 2023 | $2,904 | $260,558 | $91,194 | $169,364 |
| 2022 | $2,858 | $255,449 | $89,406 | $166,043 |
| 2021 | $2,857 | $250,440 | $87,653 | $162,787 |
| 2020 | $2,776 | $247,872 | $86,754 | $161,118 |
| 2019 | $2,763 | $243,012 | $85,053 | $157,959 |
| 2018 | $2,686 | $238,247 | $83,385 | $154,862 |
| 2017 | $2,638 | $233,575 | $81,750 | $151,825 |
| 2016 | $2,607 | $228,995 | $80,147 | $148,848 |
| 2015 | $2,580 | $225,555 | $78,943 | $146,612 |
| 2014 | $2,506 | $221,137 | $77,397 | $143,740 |
Source: Public Records
Map
Nearby Homes
- 8401 Avenida Leon
- 9154 Chelsea Ct
- 9372 Calle Vejar
- 9442 Placer St
- 9448 Calle Vejar
- 9340 Foothill Blvd
- 9340 Foothill Blvd Unit 68
- 9340 Foothill Blvd Unit 61
- 8333 Vineyard Ave Unit 4
- 8252 Malachite Ave
- 8024 Tulsa Place Unit 107
- 8167 Vineyard Ave Unit 109
- 8844 Knollwood Place
- 8055 Pueblo Place Unit 101
- 8305 Highridge Place
- 8651 Foothill Blvd Unit 106
- 8651 Foothill Blvd Unit 157
- 8651 Foothill Blvd Unit 82
- 8651 Foothill Blvd Unit 63
- 8651 Foothill Blvd Unit 18
- 8336 Montara Ave
- 8356 Montara Ave
- 8349 Lion St
- 8339 Lion St
- 8359 Lion St
- 8366 Montara Ave
- 8343 Montara Ave
- 8353 Montara Ave
- 8369 Lion St
- 8363 Montara Ave
- 8333 Montara Ave
- 8376 Montara Ave
- 9218 Placer St
- 9206 Placer St
- 8373 Montara Ave
- 8379 Lion St
- 8327 Montara Ave
- 9226 Placer St
- 9196 Placer St
- 8344 Lion St