Estimated Value: $249,000 - $377,000
4
Beds
2
Baths
1,170
Sq Ft
$280/Sq Ft
Est. Value
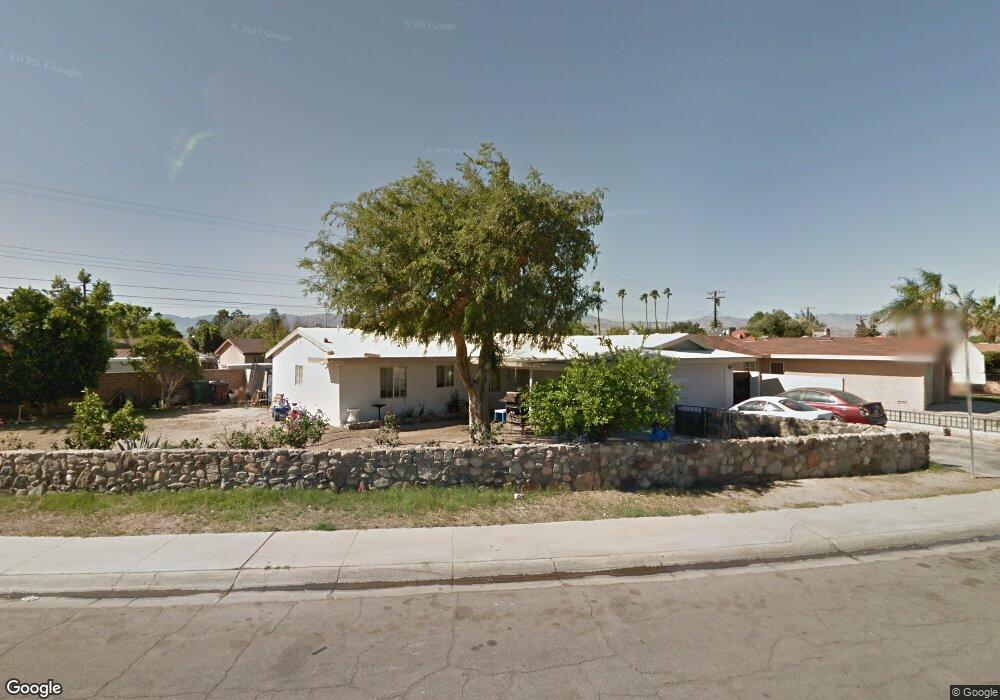
About This Home
This home is located at 83475 Ruby Ave, Indio, CA 92201 and is currently estimated at $327,970, approximately $280 per square foot. 83475 Ruby Ave is a home located in Riverside County with nearby schools including Richard R. Oliphant Elementary, Desert Ridge Academy, and Shadow Hills High School.
Ownership History
Date
Name
Owned For
Owner Type
Purchase Details
Closed on
Feb 3, 2022
Sold by
Zbs Law Llp
Bought by
Mpsn Holdings No 1 Lp
Current Estimated Value
Purchase Details
Closed on
Jan 23, 1997
Sold by
Hud
Bought by
Lopez Michelli D
Home Financials for this Owner
Home Financials are based on the most recent Mortgage that was taken out on this home.
Original Mortgage
$56,592
Interest Rate
7.86%
Mortgage Type
FHA
Purchase Details
Closed on
Jan 17, 1997
Sold by
Casarez Jose Santos
Bought by
Lopez Michelli D
Home Financials for this Owner
Home Financials are based on the most recent Mortgage that was taken out on this home.
Original Mortgage
$56,592
Interest Rate
7.86%
Mortgage Type
FHA
Purchase Details
Closed on
Jul 11, 1996
Sold by
Gomez Frank J and Gomez Stella M
Bought by
Countrywide Funding Corp
Purchase Details
Closed on
Jun 17, 1996
Sold by
Countrywide Home Loans Inc
Bought by
Hud
Create a Home Valuation Report for This Property
The Home Valuation Report is an in-depth analysis detailing your home's value as well as a comparison with similar homes in the area
Home Values in the Area
Average Home Value in this Area
Purchase History
| Date | Buyer | Sale Price | Title Company |
|---|---|---|---|
| Mpsn Holdings No 1 Lp | $203,500 | Orange Coast Title | |
| Lopez Michelli D | $57,500 | First Southwestern Title Co | |
| Lopez Michelli D | -- | First Southwestern Title Co | |
| Countrywide Funding Corp | $60,437 | Landsafe Title | |
| Hud | -- | Landsafe Title |
Source: Public Records
Mortgage History
| Date | Status | Borrower | Loan Amount |
|---|---|---|---|
| Previous Owner | Lopez Michelli D | $56,592 |
Source: Public Records
Tax History
| Year | Tax Paid | Tax Assessment Tax Assessment Total Assessment is a certain percentage of the fair market value that is determined by local assessors to be the total taxable value of land and additions on the property. | Land | Improvement |
|---|---|---|---|---|
| 2025 | $3,731 | $215,954 | $79,590 | $136,364 |
| 2023 | $3,731 | $89,980 | $31,292 | $58,688 |
| 2022 | $2,111 | $88,217 | $30,679 | $57,538 |
| 2021 | $1,695 | $86,488 | $30,078 | $56,410 |
| 2020 | $1,567 | $85,602 | $29,770 | $55,832 |
| 2019 | $1,518 | $83,925 | $29,187 | $54,738 |
| 2018 | $1,475 | $82,280 | $28,615 | $53,665 |
| 2017 | $1,452 | $80,667 | $28,054 | $52,613 |
| 2016 | $1,439 | $79,086 | $27,504 | $51,582 |
| 2015 | $1,395 | $77,900 | $27,092 | $50,808 |
| 2014 | $1,375 | $76,375 | $26,562 | $49,813 |
Source: Public Records
Map
Nearby Homes
- 83160 Tourmaline Ave
- 83335 Avenue 45
- 44095 Faye St
- 44093 Faye St
- 43965 Towne St
- 43175 Avenida Estrella
- 83773 Salva Ct
- 83037 Avenue 44
- 46050 Commerce St
- Lot 17 Commerce St
- Lot 18 Commerce St
- 42912 Gazapo Ct
- 84136 Unit 422
- 45741 Smurr St
- 84136 Avenue 44 Unit 602
- 84136 Avenue 44 Unit 306
- 84136 Avenue 44 Unit 408
- 84136 Avenue 44 Unit 340
- 84136 Avenue 44 Unit 585
- 84136 Avenue 44 Unit 609
- 83453 Ruby Ave
- 83470 Dillon Ave
- 83488 Dillon Ave
- 83462 Dillon Ave
- 83506 Dillon Ave
- 83435 Ruby Ave
- 83506 Ruby Ave
- 83524 Ruby Ave
- 83488 Ruby Ave
- 83434 Dillon Ave
- 83470 Ruby Ave
- 83542 Ruby Ave
- 83452 Ruby Ave
- 83417 Ruby Ave
- 83416 Dillon Ave
- 83560 Ruby Ave
- 83434 Ruby Ave
- 83523 Emerald Ave
- 83513 Emerald Ave
- 83533 Emerald Ave
Your Personal Tour Guide
Ask me questions while you tour the home.