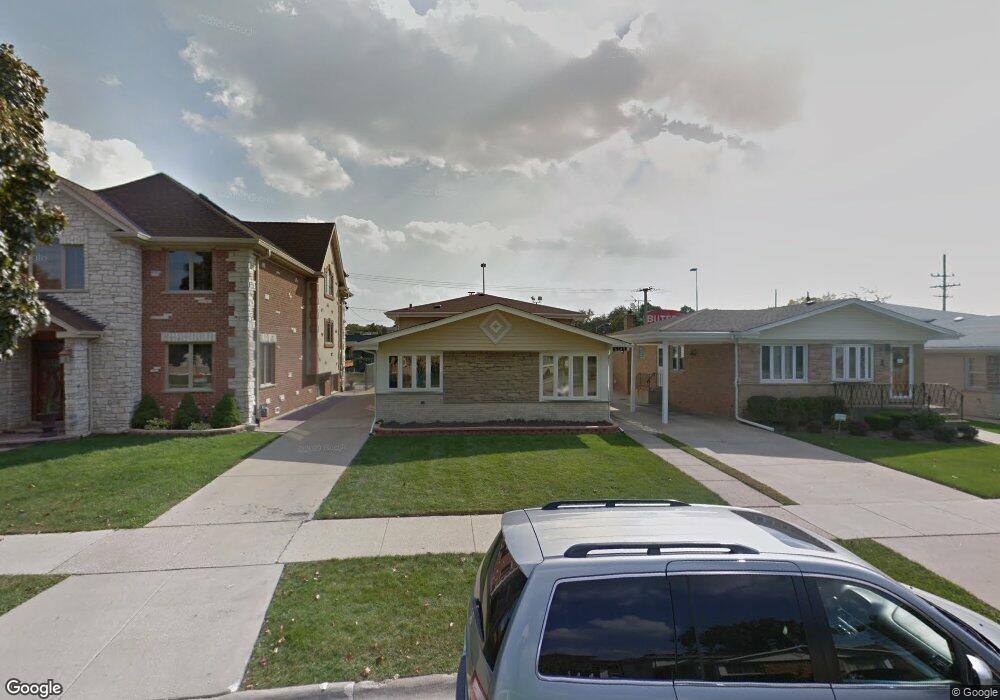
8349 W Maple Ave Norridge, IL 60706
Estimated Value: $433,943 - $527,000
3
Beds
3
Baths
1,345
Sq Ft
$349/Sq Ft
Est. Value
About This Home
This home is located at 8349 W Maple Ave, Norridge, IL 60706 and is currently estimated at $469,736, approximately $349 per square foot. 8349 W Maple Ave is a home located in Cook County with nearby schools including J Leigh Elementary School, Ridgewood Community High School, and St Eugene School.
Ownership History
Date
Name
Owned For
Owner Type
Purchase Details
Closed on
Dec 13, 2011
Sold by
Chicago Title Land Trust Company
Bought by
Muharram Sam Azzam and Abunssabeh Hala A
Current Estimated Value
Home Financials for this Owner
Home Financials are based on the most recent Mortgage that was taken out on this home.
Original Mortgage
$216,000
Outstanding Balance
$145,563
Interest Rate
3.93%
Mortgage Type
New Conventional
Estimated Equity
$324,173
Purchase Details
Closed on
Mar 29, 2011
Sold by
Tatarczuk Wesley and Tatarczuk Jadwiga
Bought by
Chicago Title Land Trust Company and Trust #8002356771
Purchase Details
Closed on
Apr 12, 2000
Sold by
Thaniotis Peter and Thaniotis Frances
Bought by
Tatarczuk Wesley and Tatarczuk Jadwiga
Home Financials for this Owner
Home Financials are based on the most recent Mortgage that was taken out on this home.
Original Mortgage
$202,000
Interest Rate
8.24%
Create a Home Valuation Report for This Property
The Home Valuation Report is an in-depth analysis detailing your home's value as well as a comparison with similar homes in the area
Home Values in the Area
Average Home Value in this Area
Purchase History
| Date | Buyer | Sale Price | Title Company |
|---|---|---|---|
| Muharram Sam Azzam | $240,000 | Chicago Tilte Land Trust Co | |
| Chicago Title Land Trust Company | -- | Chicago Title Land Trust Co | |
| Tatarczuk Wesley | $269,000 | Stewart Title |
Source: Public Records
Mortgage History
| Date | Status | Borrower | Loan Amount |
|---|---|---|---|
| Open | Muharram Sam Azzam | $216,000 | |
| Previous Owner | Tatarczuk Wesley | $202,000 |
Source: Public Records
Tax History Compared to Growth
Tax History
| Year | Tax Paid | Tax Assessment Tax Assessment Total Assessment is a certain percentage of the fair market value that is determined by local assessors to be the total taxable value of land and additions on the property. | Land | Improvement |
|---|---|---|---|---|
| 2025 | $7,071 | $39,000 | $8,500 | $30,500 |
| 2024 | $7,071 | $34,000 | $6,500 | $27,500 |
| 2023 | $6,872 | $34,000 | $6,500 | $27,500 |
| 2022 | $6,872 | $34,000 | $6,500 | $27,500 |
| 2021 | $5,924 | $26,620 | $5,750 | $20,870 |
| 2020 | $5,830 | $26,620 | $5,750 | $20,870 |
| 2019 | $5,814 | $29,876 | $5,750 | $24,126 |
| 2018 | $5,824 | $26,237 | $4,750 | $21,487 |
| 2017 | $5,696 | $26,237 | $4,750 | $21,487 |
| 2016 | $5,575 | $26,237 | $4,750 | $21,487 |
| 2015 | $5,391 | $23,791 | $4,125 | $19,666 |
| 2014 | $5,324 | $23,791 | $4,125 | $19,666 |
| 2013 | $5,201 | $23,791 | $4,125 | $19,666 |
Source: Public Records
Map
Nearby Homes
- 4534 N Cumberland Ave Unit 101
- 8444 W Wilson Ave Unit 407S
- 4623 N Chester Ave Unit 410W
- 4615 N Maria Ct
- 4615 N Anthon Ave
- 4701 N Thatcher Ave
- 8268 W Lawrence Ave
- 3916 N Pontiac Ave
- 3909 N Cumberland Ave
- 8542 W Winnemac Ave
- 4236 N Ozark Ave
- 4724 N Ozark Ave
- 5029 N East River Rd Unit 1A
- 5037 N East River Rd Unit 1B
- 4212 N Ottawa Ave
- 5139 N East River Rd Unit 170
- 3740 N Pacific Ave
- 5134 N Mission Dr
- 5151 N East River Rd Unit 331D
- 7657 W Gunnison St
- 8345 W Maple Ave
- 8353 W Maple Ave
- 8341 W Maple Ave
- 8357 W Maple Ave
- 8337 W Maple Ave
- 8333 W Maple Ave
- 8348 W Maple Ave
- 8352 W Maple Ave
- 8344 W Maple Ave
- 8356 W Maple Ave
- 8329 W Maple Ave
- 8340 W Maple Ave
- 8336 W Maple Ave
- 8332 W Maple Ave
- 8419 W Agatite Ave
- 8400 W Brodman Ave Unit 15
- 8328 W Maple Ave
- 8411 W Agatite Ave Unit 1
- 8321 W Maple Ave
- 8423 W Agatite Ave