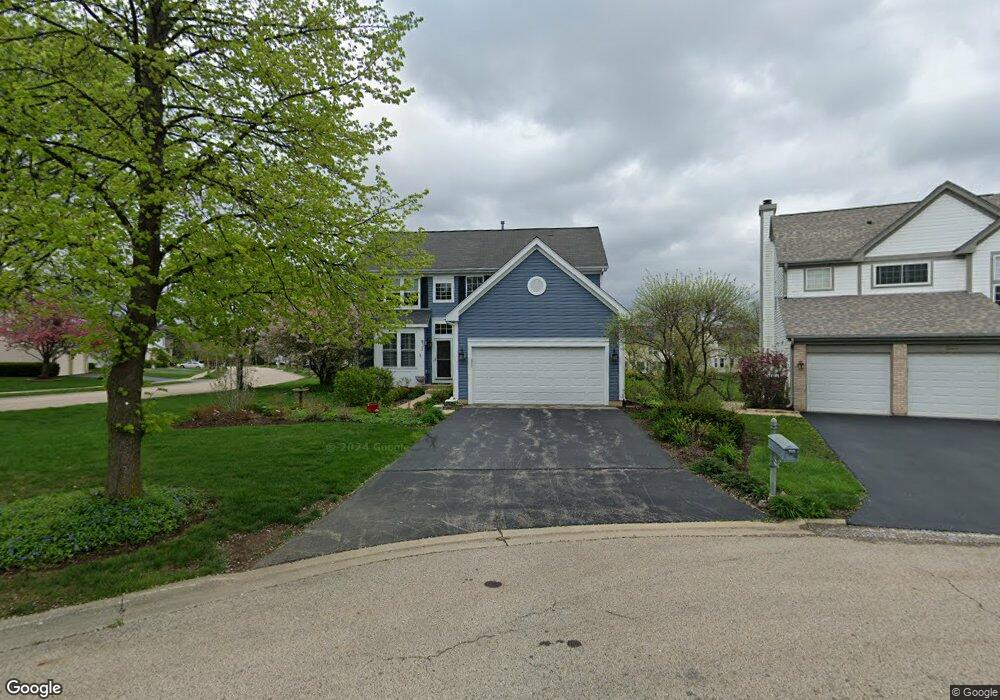
835 Bingham Ct Gurnee, IL 60031
Estimated Value: $464,000 - $484,000
4
Beds
4
Baths
2,114
Sq Ft
$224/Sq Ft
Est. Value
About This Home
This home is located at 835 Bingham Ct, Gurnee, IL 60031 and is currently estimated at $473,038, approximately $223 per square foot. 835 Bingham Ct is a home located in Lake County with nearby schools including Woodland Primary School, Woodland Elementary School, and Woodland Intermediate School.
Ownership History
Date
Name
Owned For
Owner Type
Purchase Details
Closed on
May 30, 1996
Sold by
Preus Erik R and Preus Jody K
Bought by
Long Victoria O
Current Estimated Value
Home Financials for this Owner
Home Financials are based on the most recent Mortgage that was taken out on this home.
Original Mortgage
$118,000
Interest Rate
8.05%
Mortgage Type
Balloon
Purchase Details
Closed on
Jul 27, 1994
Sold by
Northern Tr Bank Lake Forest Natl Assn
Bought by
Preus Erik R and Preus Jody K
Home Financials for this Owner
Home Financials are based on the most recent Mortgage that was taken out on this home.
Original Mortgage
$163,120
Interest Rate
6.5%
Create a Home Valuation Report for This Property
The Home Valuation Report is an in-depth analysis detailing your home's value as well as a comparison with similar homes in the area
Home Values in the Area
Average Home Value in this Area
Purchase History
| Date | Buyer | Sale Price | Title Company |
|---|---|---|---|
| Long Victoria O | $208,000 | -- | |
| Preus Erik R | $204,500 | Chicago Title Insurance Co |
Source: Public Records
Mortgage History
| Date | Status | Borrower | Loan Amount |
|---|---|---|---|
| Closed | Long Victoria O | $118,000 | |
| Previous Owner | Preus Erik R | $163,120 |
Source: Public Records
Tax History Compared to Growth
Tax History
| Year | Tax Paid | Tax Assessment Tax Assessment Total Assessment is a certain percentage of the fair market value that is determined by local assessors to be the total taxable value of land and additions on the property. | Land | Improvement |
|---|---|---|---|---|
| 2024 | $10,076 | $136,732 | $17,354 | $119,378 |
| 2023 | $9,746 | $118,530 | $15,044 | $103,486 |
| 2022 | $9,746 | $110,986 | $15,048 | $95,938 |
| 2021 | $8,789 | $106,533 | $14,444 | $92,089 |
| 2020 | $8,492 | $103,914 | $14,089 | $89,825 |
| 2019 | $8,242 | $100,897 | $13,680 | $87,217 |
| 2018 | $7,685 | $96,033 | $16,864 | $79,169 |
| 2017 | $7,595 | $93,281 | $16,381 | $76,900 |
| 2016 | $7,510 | $89,128 | $15,652 | $73,476 |
| 2015 | $7,284 | $84,529 | $14,844 | $69,685 |
| 2014 | $7,021 | $82,336 | $13,871 | $68,465 |
| 2012 | $8,118 | $93,800 | $18,810 | $74,990 |
Source: Public Records
Map
Nearby Homes
- 920 Vose Dr Unit 202
- 920 Vose Dr Unit 106
- 920 Vose Dr Unit 208
- 740 Chandler Rd Unit U85
- 706 Owl Creek Ln
- 690 Chandler Rd Unit 302
- 690 Chandler Rd Unit 207
- 650 Whitney Ct Unit 203
- 650 Whitney Ct Unit 108
- 651 White Ct
- 6296 Doral Dr
- 17603 W Windslow Dr
- 17613 W Meadowbrook Dr
- 6183 Old Farm Ln Unit 3
- 34026 N White Oak Ln Unit 48C
- 34110 N White Oak Ln Unit 37B
- 17914 W Twin Lakes Blvd
- 33485 N Mill Rd
- 17954 W Big Oaks Rd
- 17298 W Maple Ln
- 839 Bingham Ct
- 831 Adderly Ln
- 834 Adderly Ln
- 843 Bingham Ct
- 830 Adderly Ln
- 838 Adderly Ln
- 827 Adderly Ln
- 842 Adderly Ln
- 826 Adderly Ln
- 6101 Newbury Ct
- 914 Campbell Dr Unit U493
- 851 Bingham Ct
- 912 Campbell Dr
- 916 Campbell Dr Unit U494
- 855 Bingham Ct
- 823 Adderly Ln Unit 3
- 6105 Newbury Ct Unit 3
- 846 Adderly Ln
- 822 Adderly Ln
- 837 Compton Ct