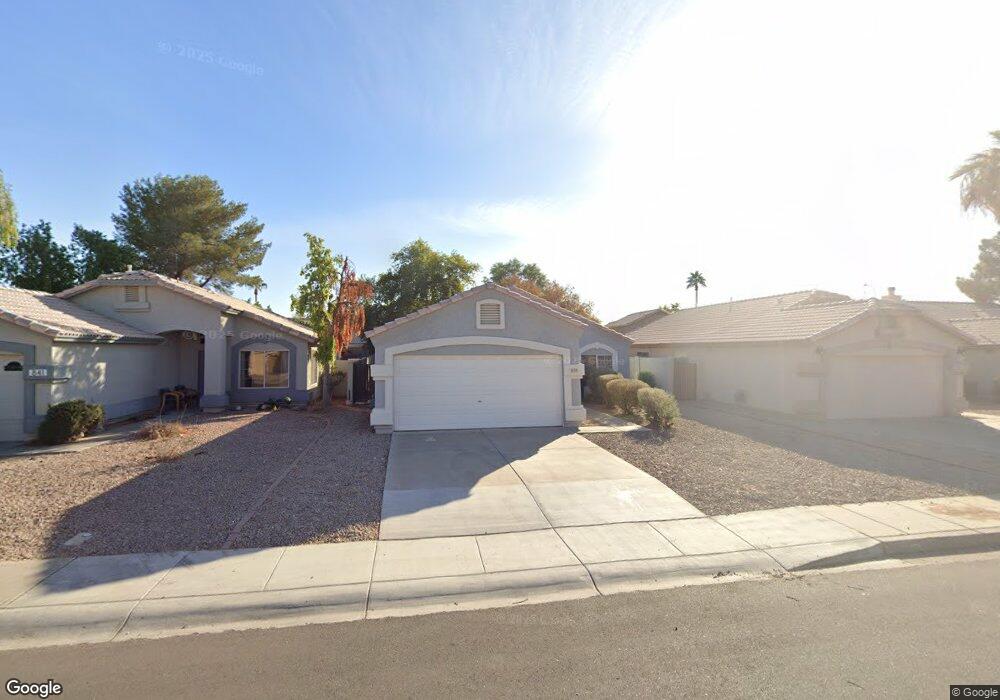
835 E Whitten St Chandler, AZ 85225
Downtown Chandler NeighborhoodEstimated Value: $399,000 - $414,000
--
Bed
2
Baths
1,123
Sq Ft
$361/Sq Ft
Est. Value
About This Home
This home is located at 835 E Whitten St, Chandler, AZ 85225 and is currently estimated at $405,133, approximately $360 per square foot. 835 E Whitten St is a home located in Maricopa County with nearby schools including Frye Elementary School, Willis Junior High School, and Chandler High School.
Ownership History
Date
Name
Owned For
Owner Type
Purchase Details
Closed on
Apr 8, 1999
Sold by
Malabanan Chris Kevin
Bought by
Rodriguez Olivia A
Current Estimated Value
Home Financials for this Owner
Home Financials are based on the most recent Mortgage that was taken out on this home.
Original Mortgage
$101,346
Outstanding Balance
$25,492
Interest Rate
6.96%
Mortgage Type
New Conventional
Estimated Equity
$379,641
Purchase Details
Closed on
Apr 18, 1995
Sold by
Key Construction Inc
Bought by
Malabanan Chris Kevin
Home Financials for this Owner
Home Financials are based on the most recent Mortgage that was taken out on this home.
Original Mortgage
$77,761
Interest Rate
8.44%
Mortgage Type
FHA
Create a Home Valuation Report for This Property
The Home Valuation Report is an in-depth analysis detailing your home's value as well as a comparison with similar homes in the area
Home Values in the Area
Average Home Value in this Area
Purchase History
| Date | Buyer | Sale Price | Title Company |
|---|---|---|---|
| Rodriguez Olivia A | $103,000 | Capital Title Agency | |
| Malabanan Chris Kevin | $80,950 | Chicago Title Insurance Co |
Source: Public Records
Mortgage History
| Date | Status | Borrower | Loan Amount |
|---|---|---|---|
| Open | Rodriguez Olivia A | $101,346 | |
| Previous Owner | Malabanan Chris Kevin | $77,761 |
Source: Public Records
Tax History Compared to Growth
Tax History
| Year | Tax Paid | Tax Assessment Tax Assessment Total Assessment is a certain percentage of the fair market value that is determined by local assessors to be the total taxable value of land and additions on the property. | Land | Improvement |
|---|---|---|---|---|
| 2025 | $1,073 | $13,772 | -- | -- |
| 2024 | $1,036 | $13,116 | -- | -- |
| 2023 | $1,036 | $28,360 | $5,670 | $22,690 |
| 2022 | $1,000 | $20,980 | $4,190 | $16,790 |
| 2021 | $1,048 | $19,230 | $3,840 | $15,390 |
| 2020 | $1,043 | $17,770 | $3,550 | $14,220 |
| 2019 | $1,003 | $15,680 | $3,130 | $12,550 |
| 2018 | $971 | $14,600 | $2,920 | $11,680 |
| 2017 | $905 | $13,160 | $2,630 | $10,530 |
| 2016 | $872 | $11,830 | $2,360 | $9,470 |
| 2015 | $845 | $11,170 | $2,230 | $8,940 |
Source: Public Records
Map
Nearby Homes
- 735 E Geronimo St
- 255 S Kingston St
- 743 E Kesler Ln
- 280 S Elizabeth Way Unit 14
- 280 S Elizabeth Way Unit 33
- 729 S Bedford Dr
- 665 E Winchester Way
- 733 E Commonwealth Ave Unit 36
- 733 E Commonwealth Ave Unit 29
- 1202 E Butler Dr
- 1047 S Sacramento Place
- 444 S Delaware St
- 1106 S Fresno Ct
- 514 E Boston Cir Unit 3
- 1224 E Derringer Way
- 857 E Buffalo St
- 1384 E Morelos St Unit 1
- 1936 E Derringer Way Unit 1
- 1321 E Springfield Place
- 1411 E Cindy St
- 841 E Whitten St
- 829 E Whitten St
- 847 E Whitten St
- 823 E Whitten St
- 836 E Glenmere Dr
- 842 E Glenmere Dr
- 830 E Glenmere Dr
- 853 E Whitten St
- 848 E Glenmere Dr
- 824 E Glenmere Dr
- 834 E Whitten St
- 828 E Whitten St
- 840 E Whitten St
- 854 E Glenmere Dr
- 859 E Whitten St
- 846 E Whitten St
- 822 E Whitten St
- 860 E Glenmere Dr
- 852 E Whitten St
- 540 S Jackson St