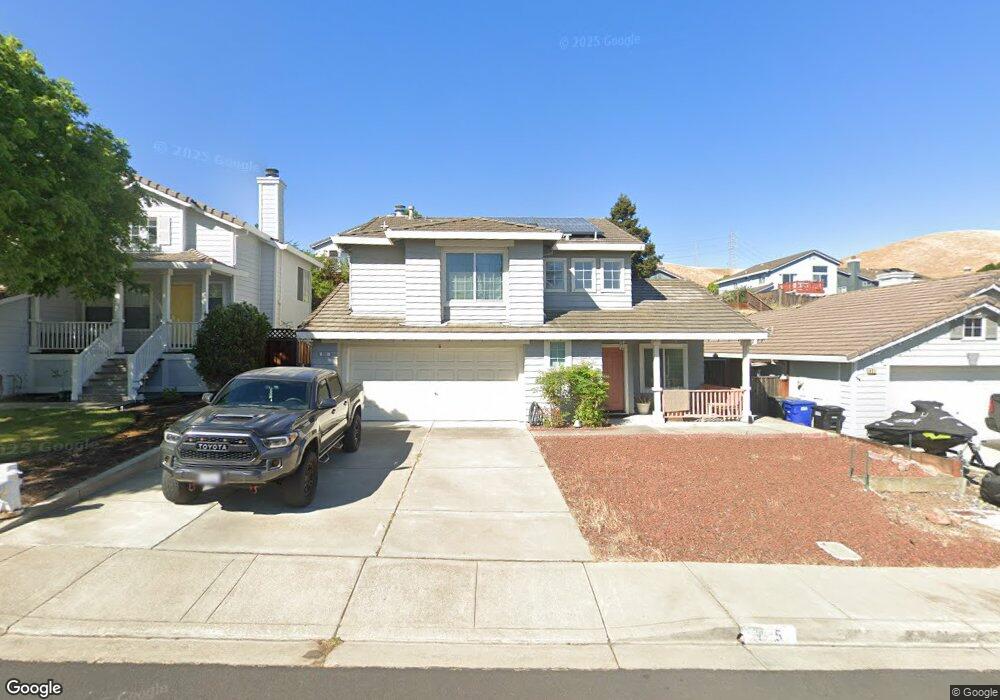
835 Steffa St Bay Point, CA 94565
Estimated Value: $591,780 - $685,000
3
Beds
3
Baths
1,426
Sq Ft
$445/Sq Ft
Est. Value
About This Home
This home is located at 835 Steffa St, Bay Point, CA 94565 and is currently estimated at $634,445, approximately $444 per square foot. 835 Steffa St is a home located in Contra Costa County with nearby schools including Shore Acres Elementary School, Riverview Middle School, and Mt. Diablo High School.
Ownership History
Date
Name
Owned For
Owner Type
Purchase Details
Closed on
Nov 14, 2022
Sold by
Salangsang Nestor Cruz and Salangsang Lucy Mark
Bought by
Nestor And Lucy Salangsang Family Trust
Current Estimated Value
Purchase Details
Closed on
Sep 13, 1994
Sold by
Kaufman & Broad Of Northern Ca Inc
Bought by
Salangsang Nestor C and Salangsang Lucy M
Home Financials for this Owner
Home Financials are based on the most recent Mortgage that was taken out on this home.
Original Mortgage
$166,350
Interest Rate
5.25%
Mortgage Type
Purchase Money Mortgage
Create a Home Valuation Report for This Property
The Home Valuation Report is an in-depth analysis detailing your home's value as well as a comparison with similar homes in the area
Home Values in the Area
Average Home Value in this Area
Purchase History
| Date | Buyer | Sale Price | Title Company |
|---|---|---|---|
| Nestor And Lucy Salangsang Family Trust | -- | -- | |
| Salangsang Nestor C | $176,000 | First American Title Co |
Source: Public Records
Mortgage History
| Date | Status | Borrower | Loan Amount |
|---|---|---|---|
| Previous Owner | Salangsang Nestor C | $166,350 |
Source: Public Records
Tax History
| Year | Tax Paid | Tax Assessment Tax Assessment Total Assessment is a certain percentage of the fair market value that is determined by local assessors to be the total taxable value of land and additions on the property. | Land | Improvement |
|---|---|---|---|---|
| 2025 | $4,760 | $295,074 | $83,962 | $211,112 |
| 2024 | $4,527 | $289,289 | $82,316 | $206,973 |
| 2023 | $4,527 | $283,617 | $80,702 | $202,915 |
| 2022 | $4,480 | $278,057 | $79,120 | $198,937 |
| 2021 | $4,368 | $272,606 | $77,569 | $195,037 |
| 2019 | $4,249 | $264,522 | $75,269 | $189,253 |
| 2018 | $4,111 | $259,337 | $73,794 | $185,543 |
| 2017 | $3,988 | $254,253 | $72,348 | $181,905 |
| 2016 | $3,876 | $249,269 | $70,930 | $178,339 |
| 2015 | $3,832 | $245,526 | $69,865 | $175,661 |
| 2014 | $3,769 | $240,718 | $68,497 | $172,221 |
Source: Public Records
Map
Nearby Homes
Your Personal Tour Guide
Ask me questions while you tour the home.