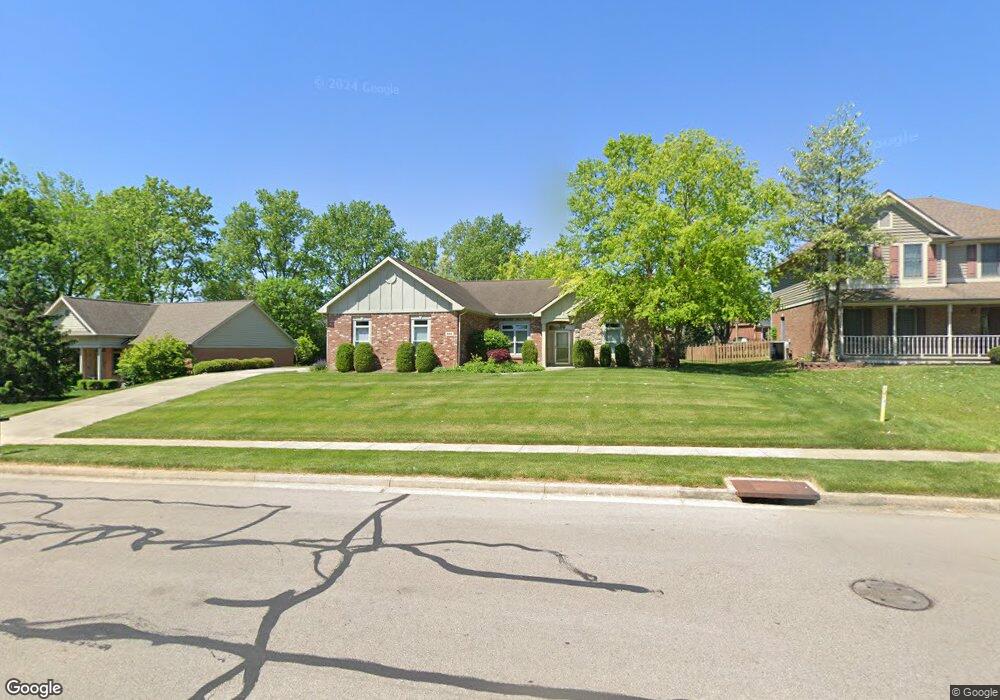
835 Sycamore Woods Dr Tipp City, OH 45371
Estimated Value: $375,697 - $459,000
3
Beds
2
Baths
1,926
Sq Ft
$219/Sq Ft
Est. Value
About This Home
This home is located at 835 Sycamore Woods Dr, Tipp City, OH 45371 and is currently estimated at $421,424, approximately $218 per square foot. 835 Sycamore Woods Dr is a home located in Miami County with nearby schools including Broadway Elementary School, L. T. Ball Intermediate School, and Nevin Coppock Elementary School.
Ownership History
Date
Name
Owned For
Owner Type
Purchase Details
Closed on
Sep 18, 2015
Sold by
Plummer Mark A and Plummer Cynthia J
Bought by
Wombold Hollis E
Current Estimated Value
Home Financials for this Owner
Home Financials are based on the most recent Mortgage that was taken out on this home.
Original Mortgage
$40,000
Outstanding Balance
$16,003
Interest Rate
3.91%
Mortgage Type
New Conventional
Estimated Equity
$405,421
Purchase Details
Closed on
May 26, 2004
Sold by
The La Jahn Co
Bought by
Plummer Mark A and Plummer Cindy J
Home Financials for this Owner
Home Financials are based on the most recent Mortgage that was taken out on this home.
Original Mortgage
$170,800
Interest Rate
5.91%
Mortgage Type
New Conventional
Purchase Details
Closed on
Dec 15, 2003
Sold by
Hawk Construction Inc
Bought by
The La Jahn Co
Purchase Details
Closed on
Jan 1, 1990
Bought by
Springhill Nurseries Co
Create a Home Valuation Report for This Property
The Home Valuation Report is an in-depth analysis detailing your home's value as well as a comparison with similar homes in the area
Home Values in the Area
Average Home Value in this Area
Purchase History
| Date | Buyer | Sale Price | Title Company |
|---|---|---|---|
| Wombold Hollis E | $230,000 | Attorney | |
| Plummer Mark A | $213,501 | -- | |
| The La Jahn Co | $48,500 | -- | |
| Springhill Nurseries Co | -- | -- |
Source: Public Records
Mortgage History
| Date | Status | Borrower | Loan Amount |
|---|---|---|---|
| Open | Wombold Hollis E | $40,000 | |
| Previous Owner | The La Jahn Co | $170,800 |
Source: Public Records
Tax History Compared to Growth
Tax History
| Year | Tax Paid | Tax Assessment Tax Assessment Total Assessment is a certain percentage of the fair market value that is determined by local assessors to be the total taxable value of land and additions on the property. | Land | Improvement |
|---|---|---|---|---|
| 2024 | $4,204 | $94,260 | $22,510 | $71,750 |
| 2023 | $4,204 | $94,260 | $22,510 | $71,750 |
| 2022 | $3,880 | $94,260 | $22,510 | $71,750 |
| 2021 | $3,335 | $75,390 | $17,990 | $57,400 |
| 2020 | $3,376 | $75,390 | $17,990 | $57,400 |
| 2019 | $3,406 | $75,390 | $17,990 | $57,400 |
| 2018 | $3,441 | $71,580 | $18,730 | $52,850 |
| 2017 | $3,454 | $71,580 | $18,730 | $52,850 |
| 2016 | $3,803 | $71,580 | $18,730 | $52,850 |
| 2015 | $3,547 | $68,810 | $17,990 | $50,820 |
| 2014 | $3,547 | $68,810 | $17,990 | $50,820 |
| 2013 | $3,565 | $68,810 | $17,990 | $50,820 |
Source: Public Records
Map
Nearby Homes
- 919 Cypress Place
- 703 Nelson Ct
- 5166 Catalpa Dr
- 625 Lantana Ct
- 760 Rosedale Dr
- 635 Kitrina Ave Unit B
- 582 Storm Ct
- 850 Todd Ct
- 549 Whispering Pines Ave
- 6690 S County Road 25a
- 465 Cayman Cir
- 5998 Sterling Ct
- 36 Regency Square
- The Prescott Plan at Fieldstone Place
- The Lynwood Plan at Emerson Crossing
- The Concord Plan at Emerson Crossing
- The Magnolia Plan at Fieldstone Place
- The Cambridge Plan at Emerson Crossing
- The Sandalwood Plan at Fieldstone Place
- The Lincoln Plan at Emerson Crossing
- 821 Sycamore Woods Dr
- 849 Sycamore Woods Dr
- 887 Buckeye Ct
- 908 Brookmere Ave
- 918 Cypress Place
- 852 Sycamore Woods Dr
- 975 Foxtail Cir
- 916 Brookmere Ave
- 876 Brookmere Ave
- 875 Buckeye Ct
- 988 Foxtail Cir
- 874 Buckeye Ct
- 873 Sycamore Woods Dr
- 926 Cypress Place
- 965 Foxtail Cir
- 864 Brookmere Ave
- 872 Sycamore Woods Dr
- 909 Brookmere Ave
- 863 Buckeye Ct
- 901 Brookmere Ave