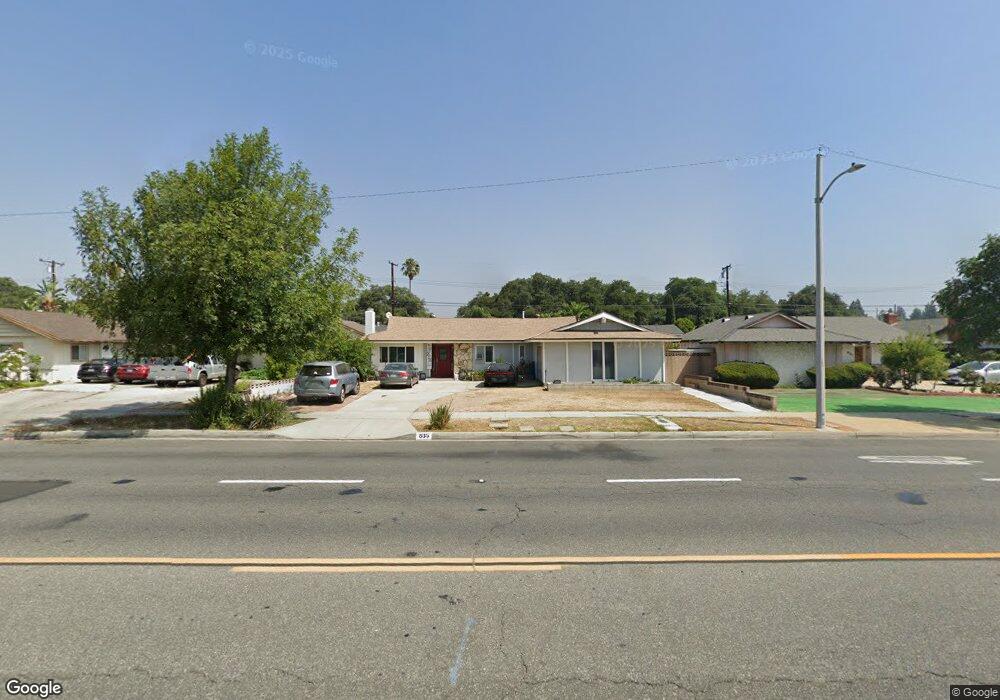
835 W 8th St Upland, CA 91786
Estimated Value: $637,000 - $723,054
3
Beds
2
Baths
1,242
Sq Ft
$550/Sq Ft
Est. Value
About This Home
This home is located at 835 W 8th St, Upland, CA 91786 and is currently estimated at $683,514, approximately $550 per square foot. 835 W 8th St is a home located in San Bernardino County with nearby schools including Citrus Elementary, Upland Junior High School, and Upland High School.
Ownership History
Date
Name
Owned For
Owner Type
Purchase Details
Closed on
Apr 6, 2015
Sold by
Ovalle Serina R
Bought by
Ovalle Serina R and The Serina R Ovalle Revocable
Current Estimated Value
Home Financials for this Owner
Home Financials are based on the most recent Mortgage that was taken out on this home.
Original Mortgage
$158,650
Outstanding Balance
$122,398
Interest Rate
3.8%
Mortgage Type
New Conventional
Estimated Equity
$561,116
Purchase Details
Closed on
Dec 4, 2012
Sold by
Ovalle Serina R
Bought by
Ovalle Serina R and Serina R Ovalle Revocable Trus
Purchase Details
Closed on
Sep 19, 2008
Sold by
Us Bank Na
Bought by
Ovalle Serina R
Home Financials for this Owner
Home Financials are based on the most recent Mortgage that was taken out on this home.
Original Mortgage
$172,500
Interest Rate
6.39%
Mortgage Type
Purchase Money Mortgage
Purchase Details
Closed on
Aug 7, 2008
Sold by
Livas Mark
Bought by
Us Bank Na and Gsamp Trust 2006-He6 Mortgage Pass Throu
Home Financials for this Owner
Home Financials are based on the most recent Mortgage that was taken out on this home.
Original Mortgage
$172,500
Interest Rate
6.39%
Mortgage Type
Purchase Money Mortgage
Purchase Details
Closed on
Jun 7, 2007
Sold by
Brown Rocky
Bought by
Summers Dream
Purchase Details
Closed on
Jun 6, 2007
Sold by
Brown Rocky
Bought by
Dickens Adam Boyer
Purchase Details
Closed on
Mar 2, 2006
Sold by
Harrell Buford K
Bought by
Livas Mark
Home Financials for this Owner
Home Financials are based on the most recent Mortgage that was taken out on this home.
Original Mortgage
$364,000
Interest Rate
7.25%
Mortgage Type
Purchase Money Mortgage
Purchase Details
Closed on
Sep 13, 2004
Sold by
Laugeson Rhonda Michelle
Bought by
Harrell Buford K
Home Financials for this Owner
Home Financials are based on the most recent Mortgage that was taken out on this home.
Original Mortgage
$308,000
Interest Rate
5.77%
Mortgage Type
Purchase Money Mortgage
Purchase Details
Closed on
Aug 26, 2001
Sold by
Laugeson Errol Dean
Bought by
Laugeson Rhonda Michelle
Purchase Details
Closed on
Jun 21, 1994
Sold by
Yoon Hyang Sook
Bought by
Laugeson Errol Dean
Home Financials for this Owner
Home Financials are based on the most recent Mortgage that was taken out on this home.
Original Mortgage
$123,824
Interest Rate
8.38%
Mortgage Type
FHA
Create a Home Valuation Report for This Property
The Home Valuation Report is an in-depth analysis detailing your home's value as well as a comparison with similar homes in the area
Home Values in the Area
Average Home Value in this Area
Purchase History
| Date | Buyer | Sale Price | Title Company |
|---|---|---|---|
| Ovalle Serina R | -- | Spl Title Services | |
| Ovalle Serina R | -- | Spl Title Services | |
| Ovalle Serina R | -- | None Available | |
| Ovalle Serina R | $250,000 | Chicago Title Company | |
| Us Bank Na | $238,700 | Accommodation | |
| Summers Dream | -- | None Available | |
| Palm Tree Pool | -- | None Available | |
| Dickens Adam Boyer | -- | None Available | |
| Roland Management Co | -- | None Available | |
| Brown Rocky | -- | None Available | |
| Livas Mark | -- | Ticor Title Company | |
| Harrell Buford K | $385,000 | Ticor Title Company | |
| Laugeson Rhonda Michelle | -- | -- | |
| Laugeson Errol Dean | $126,000 | Commonwealth Land Title |
Source: Public Records
Mortgage History
| Date | Status | Borrower | Loan Amount |
|---|---|---|---|
| Open | Ovalle Serina R | $158,650 | |
| Closed | Ovalle Serina R | $172,500 | |
| Previous Owner | Livas Mark | $364,000 | |
| Previous Owner | Harrell Buford K | $308,000 | |
| Previous Owner | Laugeson Errol Dean | $123,824 | |
| Closed | Harrell Buford K | $77,000 |
Source: Public Records
Tax History
| Year | Tax Paid | Tax Assessment Tax Assessment Total Assessment is a certain percentage of the fair market value that is determined by local assessors to be the total taxable value of land and additions on the property. | Land | Improvement |
|---|---|---|---|---|
| 2025 | $5,829 | $321,942 | $112,038 | $209,904 |
| 2024 | $5,715 | $315,629 | $109,841 | $205,788 |
| 2023 | $5,660 | $309,440 | $107,687 | $201,753 |
| 2022 | $5,575 | $303,372 | $105,575 | $197,797 |
| 2021 | $5,567 | $297,424 | $103,505 | $193,919 |
| 2020 | $5,476 | $294,375 | $102,444 | $191,931 |
| 2019 | $5,537 | $288,603 | $100,435 | $188,168 |
| 2018 | $5,386 | $282,944 | $98,466 | $184,478 |
| 2017 | $3,060 | $277,396 | $96,535 | $180,861 |
| 2016 | $2,864 | $271,957 | $94,642 | $177,315 |
| 2015 | $2,797 | $267,872 | $93,220 | $174,652 |
| 2014 | $2,724 | $262,625 | $91,394 | $171,231 |
Source: Public Records
Map
Nearby Homes
- 428 W 8th St
- 435 W 9th St Unit B3
- 885 W Arrow Hwy
- 333 White Ave
- 595 Juniper Ave
- 633 Maple Way
- 296 S Laurel Ave
- 345 S Euclid Ave
- 107 N 1st Ave
- 111 N 1st Ave
- Plan 3 at Towns on First - Towns On First
- Plan 4 at Towns on First - Towns On First
- 127 N 1st Ave
- 161 N 1st Ave
- 145 N 1st Ave
- 134 Coral Way
- 0 Bay St Unit AR25093919
- 846 Amber Ct
- 509 N Euclid Ave
- 636 N Palm Ave
Your Personal Tour Guide
Ask me questions while you tour the home.