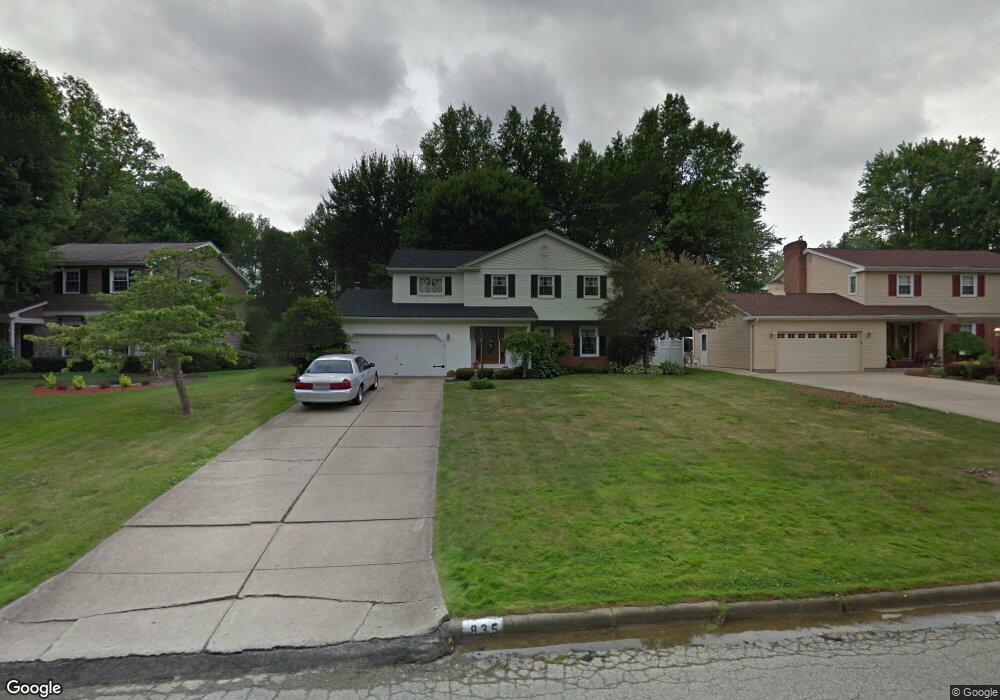
835 Westport Dr Youngstown, OH 44511
Estimated Value: $286,000 - $339,000
4
Beds
2
Baths
2,212
Sq Ft
$140/Sq Ft
Est. Value
About This Home
This home is located at 835 Westport Dr, Youngstown, OH 44511 and is currently estimated at $308,654, approximately $139 per square foot. 835 Westport Dr is a home located in Mahoning County with nearby schools including West Boulevard Elementary School, Boardman Center Middle School, and Boardman High School.
Ownership History
Date
Name
Owned For
Owner Type
Purchase Details
Closed on
Dec 27, 2022
Bought by
Gary M Smith
Current Estimated Value
Purchase Details
Closed on
Jan 24, 2022
Sold by
Smith Marilynn
Bought by
Smith Gary and Smith Marilynn
Purchase Details
Closed on
Mar 1, 2004
Sold by
Smith Carroll D and Smith Marilynn
Bought by
Smith Carroll D and Smith Marilynn
Purchase Details
Closed on
Oct 6, 1966
Bought by
Smith Carroll D and Smith M
Create a Home Valuation Report for This Property
The Home Valuation Report is an in-depth analysis detailing your home's value as well as a comparison with similar homes in the area
Home Values in the Area
Average Home Value in this Area
Purchase History
| Date | Buyer | Sale Price | Title Company |
|---|---|---|---|
| Gary M Smith | -- | -- | |
| Smith Gary M | -- | -- | |
| Smith Gary | -- | -- | |
| Smith Carroll D | -- | -- | |
| Smith Carroll D | -- | -- |
Source: Public Records
Tax History Compared to Growth
Tax History
| Year | Tax Paid | Tax Assessment Tax Assessment Total Assessment is a certain percentage of the fair market value that is determined by local assessors to be the total taxable value of land and additions on the property. | Land | Improvement |
|---|---|---|---|---|
| 2024 | $4,348 | $86,210 | $8,550 | $77,660 |
| 2023 | $4,290 | $86,210 | $8,550 | $77,660 |
| 2022 | $3,029 | $55,150 | $7,760 | $47,390 |
| 2021 | $3,031 | $55,150 | $7,760 | $47,390 |
| 2020 | $3,046 | $55,150 | $7,760 | $47,390 |
| 2019 | $3,244 | $53,030 | $7,460 | $45,570 |
| 2018 | $2,806 | $53,030 | $7,460 | $45,570 |
| 2017 | $2,803 | $53,030 | $7,460 | $45,570 |
| 2016 | $2,568 | $48,920 | $7,460 | $41,460 |
| 2015 | $2,516 | $48,920 | $7,460 | $41,460 |
| 2014 | $2,524 | $48,920 | $7,460 | $41,460 |
| 2013 | $2,492 | $48,920 | $7,460 | $41,460 |
Source: Public Records
Map
Nearby Homes
- 990 Westport Dr
- 21.19 acres Truesdale and Lockwood Rd
- 29 Gillian Ln
- 537 W Glen Dr
- 5200 West Blvd Unit 505
- 4478 Devonshire Dr Unit 1B
- 272 Shields Rd
- 5670 Tracy Dr
- 715 Crestview Dr
- 3927 Hopkins Rd
- 5020 Friendship Ave
- 772 Ewing Rd
- 4042 Baymar Dr
- 1342 Shields Rd
- 138 Robinhood Way
- 5097 Tippwood Ct
- 4225 Stratford Rd
- 813 Brookfield Ave
- 6632 Harrington Ave
- 117 Overhill Rd
- 829 Westport Dr
- 841 Westport Dr
- 821 Westport Dr
- 845 Westport Dr
- 838 Shields Rd
- 842 Shields Rd
- 830 Shields Rd
- 838 Westport Dr
- 834 Westport Dr
- 815 Westport Dr
- 842 Westport Dr
- 849 Westport Dr
- 824 Shields Rd
- 854 Shields Rd
- 830 Westport Dr
- 818 Shields Rd
- 824 Westport Dr
- 853 Westport Dr
- 852 Westport Dr
- 844 Cove Place