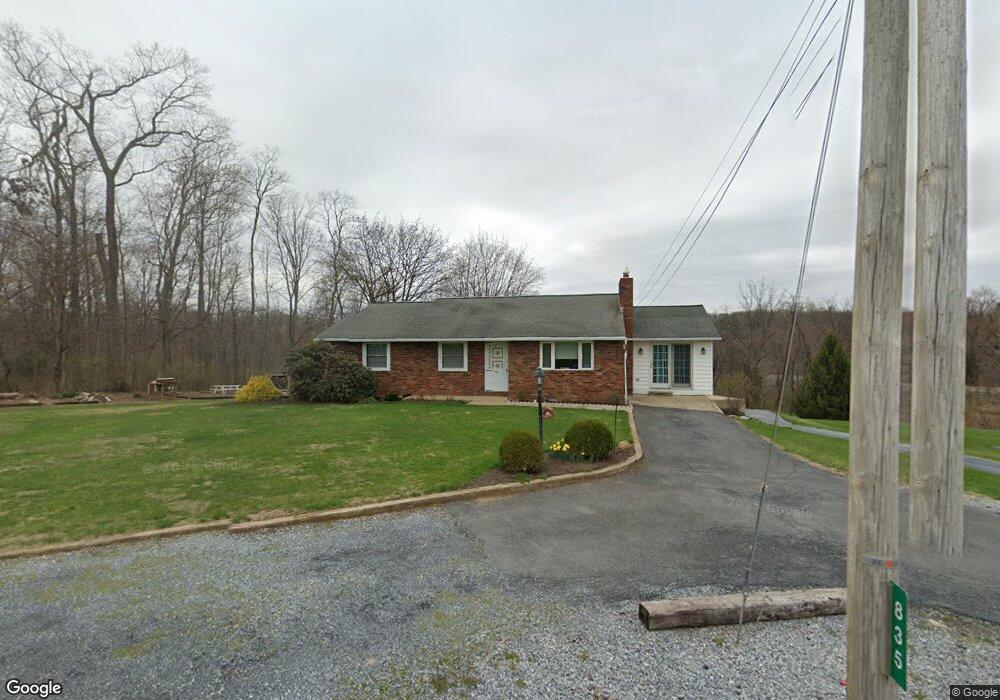
835 Wollups Hill Rd Stevens, PA 17578
Estimated Value: $319,000 - $385,000
2
Beds
2
Baths
1,122
Sq Ft
$306/Sq Ft
Est. Value
About This Home
This home is located at 835 Wollups Hill Rd, Stevens, PA 17578 and is currently estimated at $343,886, approximately $306 per square foot. 835 Wollups Hill Rd is a home located in Lancaster County with nearby schools including Cocalico Senior High School and Reamstown Mennonite School.
Ownership History
Date
Name
Owned For
Owner Type
Purchase Details
Closed on
Oct 1, 2007
Sold by
Martin David H and Martin Sandra M
Bought by
Wenger Galen R and Wenger Jalisa D
Current Estimated Value
Home Financials for this Owner
Home Financials are based on the most recent Mortgage that was taken out on this home.
Original Mortgage
$200,000
Outstanding Balance
$126,756
Interest Rate
6.59%
Mortgage Type
Purchase Money Mortgage
Estimated Equity
$217,130
Purchase Details
Closed on
Jul 10, 2002
Sold by
Gockley Laura A
Bought by
Gockley Clarence V
Purchase Details
Closed on
Nov 22, 1999
Sold by
Graybill Arlene and Graybill Harold H
Bought by
Gockley Clarence V and Gockley Laura A
Home Financials for this Owner
Home Financials are based on the most recent Mortgage that was taken out on this home.
Original Mortgage
$88,000
Interest Rate
7.76%
Create a Home Valuation Report for This Property
The Home Valuation Report is an in-depth analysis detailing your home's value as well as a comparison with similar homes in the area
Home Values in the Area
Average Home Value in this Area
Purchase History
| Date | Buyer | Sale Price | Title Company |
|---|---|---|---|
| Wenger Galen R | $210,000 | None Available | |
| Gockley Clarence V | -- | -- | |
| Gockley Clarence V | $110,000 | -- |
Source: Public Records
Mortgage History
| Date | Status | Borrower | Loan Amount |
|---|---|---|---|
| Open | Wenger Galen R | $200,000 | |
| Previous Owner | Gockley Clarence V | $88,000 |
Source: Public Records
Tax History Compared to Growth
Tax History
| Year | Tax Paid | Tax Assessment Tax Assessment Total Assessment is a certain percentage of the fair market value that is determined by local assessors to be the total taxable value of land and additions on the property. | Land | Improvement |
|---|---|---|---|---|
| 2025 | $4,333 | $173,200 | $75,600 | $97,600 |
| 2024 | $4,333 | $173,200 | $75,600 | $97,600 |
| 2023 | $4,233 | $173,200 | $75,600 | $97,600 |
| 2022 | $4,121 | $173,200 | $75,600 | $97,600 |
| 2021 | $4,121 | $173,200 | $75,600 | $97,600 |
| 2020 | $4,121 | $173,200 | $75,600 | $97,600 |
| 2019 | $4,073 | $173,200 | $75,600 | $97,600 |
| 2018 | $4,831 | $173,200 | $75,600 | $97,600 |
| 2017 | $3,982 | $138,600 | $31,500 | $107,100 |
| 2016 | $3,982 | $138,600 | $31,500 | $107,100 |
| 2015 | $819 | $138,600 | $31,500 | $107,100 |
| 2014 | $2,914 | $138,600 | $31,500 | $107,100 |
Source: Public Records
Map
Nearby Homes
- 1265L Swamp Bridge Rd
- 755 Poplar St
- 627 Pine St
- 514 N 6th St
- 540 Horseshoe Trail Rd
- 505 Hertzog Valley Rd
- 35 Bonview Dr
- 675 S Ridge Rd
- 210 Stevens Rd
- 125 Indiantown Rd
- 0 Wabash Rd
- 345 Village Spring Ln
- 37 W Church St
- 105 N Reamstown Rd
- 65 S Reamstown Rd
- 490 Weidmansville Rd
- 0 Weidmansville Rd
- 131 Sunrise Ln
- 144 Sunrise Ln
- Amberbrook Plan at Wyndale
- 805 Wollups Hill Rd
- 875 Wollups Hill Rd
- 0 Wollups Hill Rd
- 955 Wollups Hill Rd Unit LT 3
- 955 Wollups Hill Rd
- 955 Wollups Hill Rd
- 955 Wollups Hill Rd
- 955 Wollups Hill Rd Unit LT 3
- 785 Wollups Hill Rd
- 775 Wollups Hill Rd
- 915 Wollups Hill Rd
- 765 Wollups Hill Rd
- 735 Wollups Hill Rd
- 100 E Queen St
- 795 Wollups Hill Rd
- 740 Wollups Hill Rd
- 730 Wollups Hill Rd
- 715 Wollups Hill Rd
- 1610 Steinmetz Rd
- 720 Wollups Hill Rd