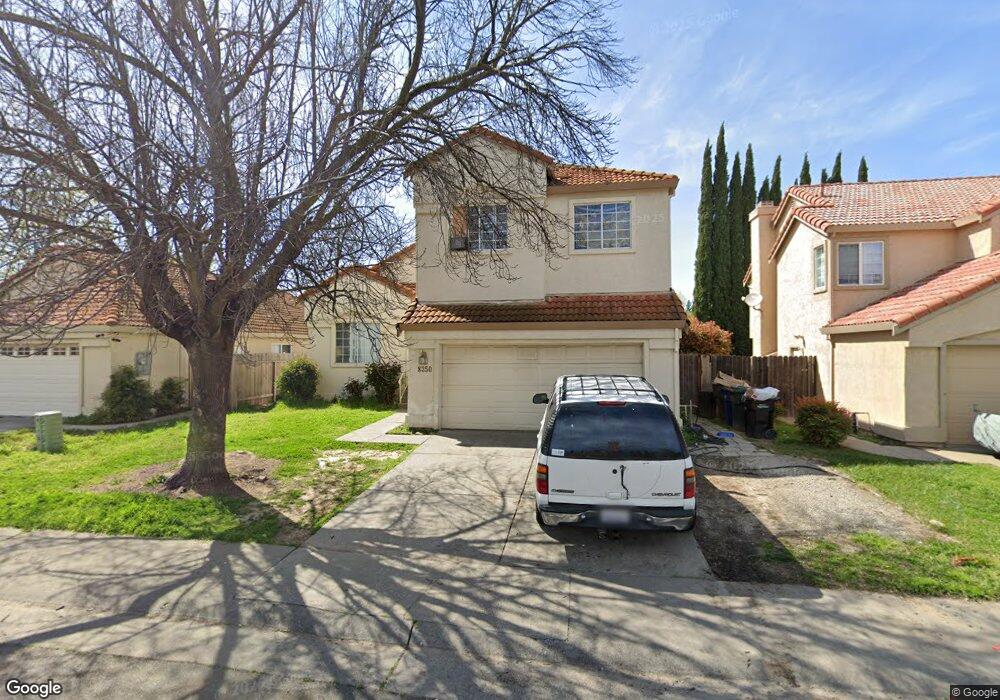
8350 Dalkeith Way Antelope, CA 95843
Estimated Value: $381,000 - $546,000
4
Beds
3
Baths
2,083
Sq Ft
$236/Sq Ft
Est. Value
About This Home
This home is located at 8350 Dalkeith Way, Antelope, CA 95843 and is currently estimated at $491,093, approximately $235 per square foot. 8350 Dalkeith Way is a home located in Sacramento County with nearby schools including Antelope Meadows Elementary School, Antelope Crossing Middle School, and Antelope High School.
Ownership History
Date
Name
Owned For
Owner Type
Purchase Details
Closed on
Dec 23, 2002
Sold by
Singh Preet and Kaur Sundeep
Bought by
Singh Jasvinder K and Singh Joga
Current Estimated Value
Home Financials for this Owner
Home Financials are based on the most recent Mortgage that was taken out on this home.
Original Mortgage
$200,000
Outstanding Balance
$84,177
Interest Rate
5.96%
Estimated Equity
$406,916
Purchase Details
Closed on
Nov 7, 2000
Sold by
Federal Home Mtg Corp
Bought by
Singh Preet and Kaur Sundeep
Home Financials for this Owner
Home Financials are based on the most recent Mortgage that was taken out on this home.
Original Mortgage
$159,340
Interest Rate
7.82%
Purchase Details
Closed on
May 25, 2000
Sold by
Herman James R and Herman Melisa J
Bought by
Federal Home Loan Mortgage Corporation
Create a Home Valuation Report for This Property
The Home Valuation Report is an in-depth analysis detailing your home's value as well as a comparison with similar homes in the area
Home Values in the Area
Average Home Value in this Area
Purchase History
| Date | Buyer | Sale Price | Title Company |
|---|---|---|---|
| Singh Jasvinder K | $125,000 | Alliance Title Company | |
| Singh Preet | $174,000 | First American Title Ins Co | |
| Federal Home Loan Mortgage Corporation | $148,310 | First American Title Co |
Source: Public Records
Mortgage History
| Date | Status | Borrower | Loan Amount |
|---|---|---|---|
| Open | Singh Jasvinder K | $200,000 | |
| Closed | Singh Preet | $159,340 |
Source: Public Records
Tax History
| Year | Tax Paid | Tax Assessment Tax Assessment Total Assessment is a certain percentage of the fair market value that is determined by local assessors to be the total taxable value of land and additions on the property. | Land | Improvement |
|---|---|---|---|---|
| 2025 | $3,909 | $362,057 | $72,401 | $289,656 |
| 2024 | $3,909 | $354,959 | $70,982 | $283,977 |
| 2023 | $3,868 | $348,000 | $69,591 | $278,409 |
| 2022 | $3,874 | $341,177 | $68,227 | $272,950 |
| 2021 | $3,896 | $334,489 | $66,890 | $267,599 |
| 2020 | $3,867 | $331,061 | $66,205 | $264,856 |
| 2019 | $3,814 | $324,570 | $64,907 | $259,663 |
| 2018 | $3,680 | $318,207 | $63,635 | $254,572 |
| 2017 | $3,629 | $311,969 | $62,388 | $249,581 |
| 2016 | $3,537 | $305,853 | $61,165 | $244,688 |
| 2015 | $3,192 | $275,875 | $55,171 | $220,704 |
| 2014 | $2,974 | $255,440 | $51,084 | $204,356 |
Source: Public Records
Map
Nearby Homes
- 8233 Dalkeith Way
- 4246 Albertville Way
- 8434 Walerga Rd Unit 327
- 8256 Benjamin Dr
- 8121 Deer Spring Cir
- 4142 Lake Placid Ct
- 8020 Walerga Rd Unit 3
- 8020 Walerga Rd Unit 1093
- 4115 Copper Hill Ct
- 8304 Oakenshield Cir
- 8625 Valley Rim Way
- 4133 Singing Tree Way
- 4009 Honey Rose Place
- 3941 Grey Livery Way
- 10100 Pixley Ct
- 728 Patton Dr
- 418 Colin Kelly Dr
- 10084 Pixley Ct
- 4625 Shade Tree Way
- 4767 Morgan Oak Ct
- 8346 Dalkeith Way
- 8354 Dalkeith Way
- 4327 Gairlock Ct
- 8342 Dalkeith Way
- 8320 Dalkeith Way
- 8349 Dalkeith Way
- 8353 Dalkeith Way
- 8345 Dalkeith Way
- 8357 Dalkeith Way
- 4321 Gairlock Ct
- 4336 Gairlock Ct
- 4332 Gairlock Ct
- 8341 Dalkeith Way
- 8312 Dalkeith Way
- 8361 Dalkeith Way
- 4328 Gairlock Ct
- 4320 Gairlock Ct
- 4324 Gairlock Ct
- 8325 Dalkeith Way
- 8329 Dalkeith Way
Your Personal Tour Guide
Ask me questions while you tour the home.