Estimated Value: $773,000 - $1,018,000
2
Beds
2
Baths
3,700
Sq Ft
$230/Sq Ft
Est. Value
About This Home
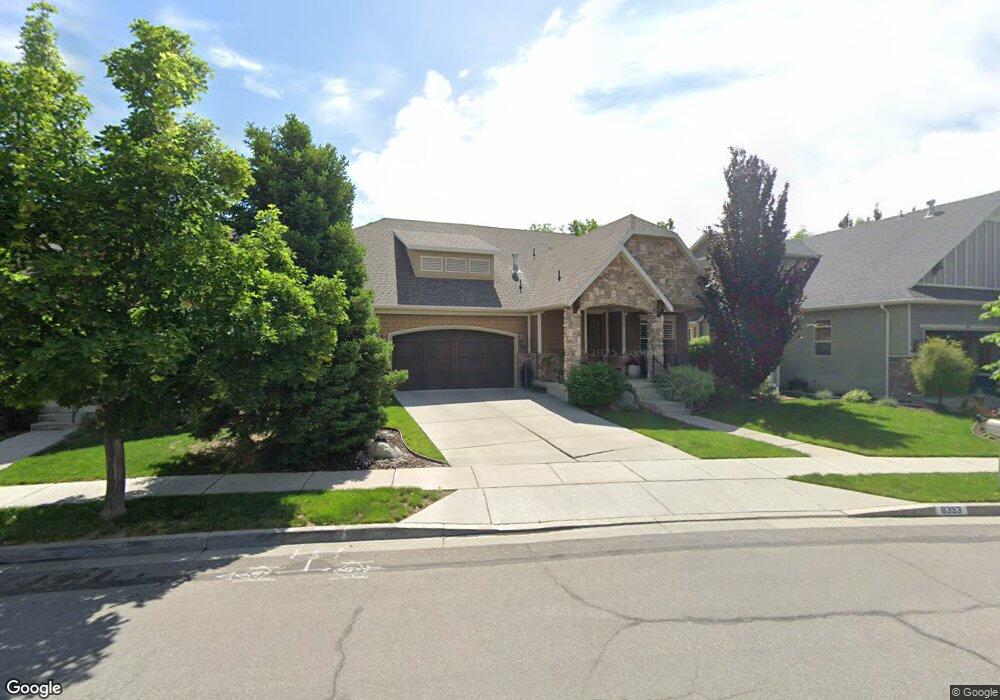
This home is located at 8353 Lorimer Ln, Sandy, UT 84070 and is currently estimated at $851,026, approximately $230 per square foot. 8353 Lorimer Ln is a home located in Salt Lake County with nearby schools including Midvalley Elementary School, Union Middle School, and Hillcrest High School.
Ownership History
Date
Name
Owned For
Owner Type
Purchase Details
Closed on
Dec 31, 2024
Sold by
Tanner Michelle and Newman Michelle
Bought by
Mn Business Services Llc
Current Estimated Value
Purchase Details
Closed on
Mar 2, 2023
Sold by
Christian Robert A
Bought by
Tanner Michelle
Home Financials for this Owner
Home Financials are based on the most recent Mortgage that was taken out on this home.
Original Mortgage
$760,000
Interest Rate
6.15%
Mortgage Type
New Conventional
Purchase Details
Closed on
Jun 17, 2022
Sold by
Veda Carol Daley Trust
Bought by
Christian Robert A and Christian Rena E
Purchase Details
Closed on
Apr 16, 2012
Sold by
Daley Carol and Daley Ve Da Carol
Bought by
Daley Veda Carol
Purchase Details
Closed on
Mar 8, 2007
Sold by
Prince Development Llc
Bought by
Daley Carol
Create a Home Valuation Report for This Property
The Home Valuation Report is an in-depth analysis detailing your home's value as well as a comparison with similar homes in the area
Home Values in the Area
Average Home Value in this Area
Purchase History
| Date | Buyer | Sale Price | Title Company |
|---|---|---|---|
| Mn Business Services Llc | -- | None Listed On Document | |
| Tanner Michelle | -- | -- | |
| Christian Robert A | -- | Rudd & Hawkes Title | |
| Daley Veda Carol | -- | None Available | |
| Daley Carol | -- | Guardian Title |
Source: Public Records
Mortgage History
| Date | Status | Borrower | Loan Amount |
|---|---|---|---|
| Previous Owner | Tanner Michelle | $760,000 |
Source: Public Records
Tax History
| Year | Tax Paid | Tax Assessment Tax Assessment Total Assessment is a certain percentage of the fair market value that is determined by local assessors to be the total taxable value of land and additions on the property. | Land | Improvement |
|---|---|---|---|---|
| 2025 | $4,228 | $793,500 | $138,600 | $654,900 |
| 2024 | $4,228 | $781,000 | $129,500 | $651,500 |
| 2023 | $4,228 | $653,600 | $123,200 | $530,400 |
| 2022 | $3,424 | $616,800 | $120,700 | $496,100 |
| 2021 | $3,221 | $493,000 | $103,200 | $389,800 |
| 2020 | $3,075 | $444,100 | $103,200 | $340,900 |
| 2019 | $3,101 | $436,200 | $97,400 | $338,800 |
| 2018 | $2,828 | $401,900 | $97,400 | $304,500 |
| 2017 | $2,824 | $383,500 | $97,400 | $286,100 |
| 2016 | $2,736 | $360,300 | $97,400 | $262,900 |
| 2015 | $2,714 | $331,500 | $94,500 | $237,000 |
| 2014 | $2,503 | $300,300 | $86,700 | $213,600 |
Source: Public Records
Map
Nearby Homes
- 8322 S Levine Ln Unit 111
- 8292 S 560 E
- 8260 S 560 E
- 8248 S Romaine Dr
- 359 E 8400 S
- 744 E 8425 S
- 8087 S 615 E
- 8459 S 300 E
- 760 E 8080 S
- 274 E Water Mill Way Unit 230
- 8268 S 865 E
- 8023 S Pinewood Dr
- 257 Water Mill Way Unit 211
- 257 E Water Mill Way
- 393 E Corral Creek Dr
- 8450 S 865 E
- 8257 S 180 E
- 379 E Horse Creek Dr
- 194 Pioneer Ave
- 144 E Chambord Ct
- 8353 S Lorimer Ln
- 8341 Lorimer Ln
- 8341 S Lorimer Ln
- 8361 Lorimer Ln
- 8354 S Levine Ln Unit 108
- 8333 Lorimer Ln
- 8333 S Lorimer Ln
- 8366 S Levine Ln Unit 204
- 8342 S Levine Ln Unit 109
- 8373 Lorimer Ln
- 8373 S Lorimer Ln
- 8374 S Levine Ln Unit 203
- 8352 Lorimer Ln
- 8352 S Lorimer Ln
- 8323 S Lorimer Ln
- 8323 Lorimer Ln
- 8332 S Levine Ln Unit 110
- 8332 Lorimer Ln
- 8338 Lorimer Ln
- 8338 S Lorimer Ln
Your Personal Tour Guide
Ask me questions while you tour the home.