8353 State Route 163 Millstadt, IL 62260
Estimated Value: $291,406 - $427,000
4
Beds
2
Baths
2,384
Sq Ft
$140/Sq Ft
Est. Value
About This Home
This home is located at 8353 State Route 163, Millstadt, IL 62260 and is currently estimated at $333,852, approximately $140 per square foot. 8353 State Route 163 is a home located in St. Clair County with nearby schools including Millstadt Primary Center, Millstadt Consolidated School, and Our Lady Queen Of Peace Catholic School.
Ownership History
Date
Name
Owned For
Owner Type
Purchase Details
Closed on
Aug 20, 2021
Sold by
Trankle Reginald
Bought by
Anthony Jason
Current Estimated Value
Home Financials for this Owner
Home Financials are based on the most recent Mortgage that was taken out on this home.
Original Mortgage
$224,852
Outstanding Balance
$203,997
Interest Rate
2.75%
Mortgage Type
FHA
Estimated Equity
$129,855
Purchase Details
Closed on
Dec 5, 2011
Sold by
Trankle Reggie and Trankle Reginald
Bought by
Trankle Reginald
Home Financials for this Owner
Home Financials are based on the most recent Mortgage that was taken out on this home.
Original Mortgage
$135,000
Interest Rate
4.11%
Mortgage Type
New Conventional
Purchase Details
Closed on
Sep 1, 2010
Sold by
Federal Home Loan Mortgage Corporation
Bought by
Trankle Reggie
Home Financials for this Owner
Home Financials are based on the most recent Mortgage that was taken out on this home.
Original Mortgage
$119,700
Interest Rate
4.54%
Mortgage Type
New Conventional
Purchase Details
Closed on
Apr 5, 2010
Sold by
Fults Jerome
Bought by
Federal Home Loan Mortgage Corp
Create a Home Valuation Report for This Property
The Home Valuation Report is an in-depth analysis detailing your home's value as well as a comparison with similar homes in the area
Home Values in the Area
Average Home Value in this Area
Purchase History
| Date | Buyer | Sale Price | Title Company |
|---|---|---|---|
| Anthony Jason | $229,000 | Accommodation | |
| Trankle Reginald | -- | Nations Title Agency Of Miss | |
| Trankle Reggie | $126,000 | Atg | |
| Federal Home Loan Mortgage Corp | -- | None Available |
Source: Public Records
Mortgage History
| Date | Status | Borrower | Loan Amount |
|---|---|---|---|
| Open | Anthony Jason | $224,852 | |
| Previous Owner | Trankle Reginald | $135,000 | |
| Previous Owner | Trankle Reggie | $119,700 |
Source: Public Records
Tax History Compared to Growth
Tax History
| Year | Tax Paid | Tax Assessment Tax Assessment Total Assessment is a certain percentage of the fair market value that is determined by local assessors to be the total taxable value of land and additions on the property. | Land | Improvement |
|---|---|---|---|---|
| 2024 | $5,043 | $70,710 | $9,428 | $61,282 |
| 2023 | $4,746 | $63,445 | $8,459 | $54,986 |
| 2022 | $4,503 | $57,573 | $7,676 | $49,897 |
| 2021 | $4,352 | $53,452 | $7,127 | $46,325 |
| 2020 | $3,889 | $46,520 | $6,933 | $39,587 |
| 2019 | $3,347 | $46,520 | $6,933 | $39,587 |
| 2018 | $3,216 | $44,453 | $6,625 | $37,828 |
| 2017 | $3,266 | $41,400 | $6,170 | $35,230 |
| 2016 | $3,427 | $47,516 | $5,861 | $41,655 |
| 2014 | $3,189 | $47,789 | $5,895 | $41,894 |
| 2013 | $3,748 | $50,985 | $6,289 | $44,696 |
Source: Public Records
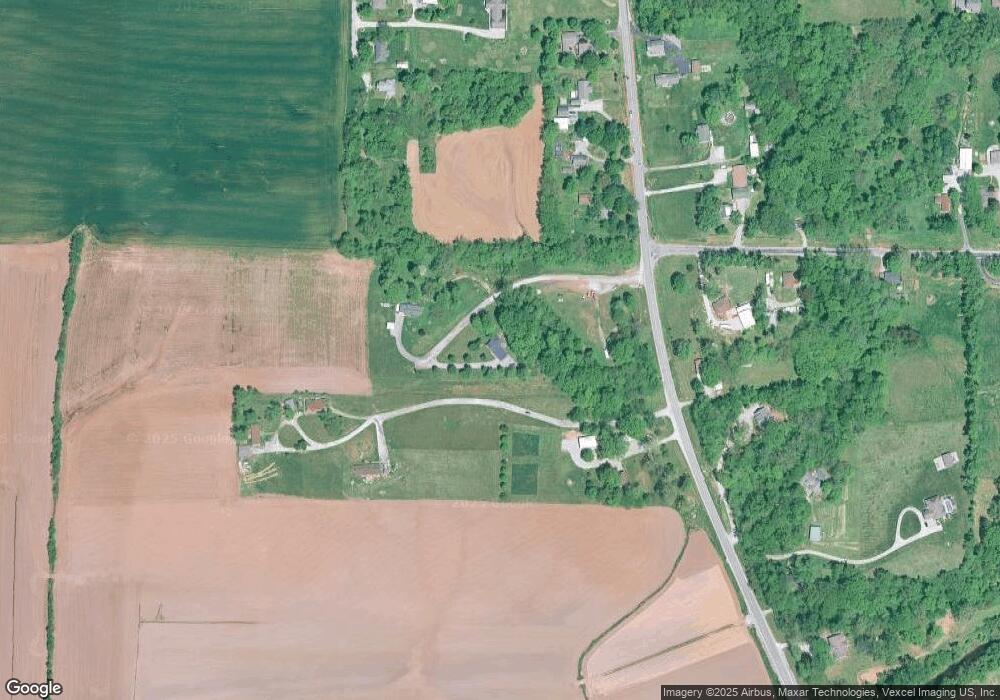
Map
Nearby Homes
- 8349 State Route 163
- 8338 State Route 163
- 8331 State Route 163
- 8407 State Route 163
- 7372 Town Hall Rd
- 7372 Town Hall Rd
- 7365 Town Hall Rd
- 8412 Tebby Ln
- 8408 State Route 163
- 8404 State Route 163
- 7360 Town Hall Rd
- 8416 Tebby Ln
- 8420 Tebby Ln
- 8420 State Route 163
- 7359 Town Hall Rd
- 8424 Tebby Ln
- 8320 State Route 163
- 8431 State Route 163
- 8428 Tebby Ln
- 8316 State Route 163