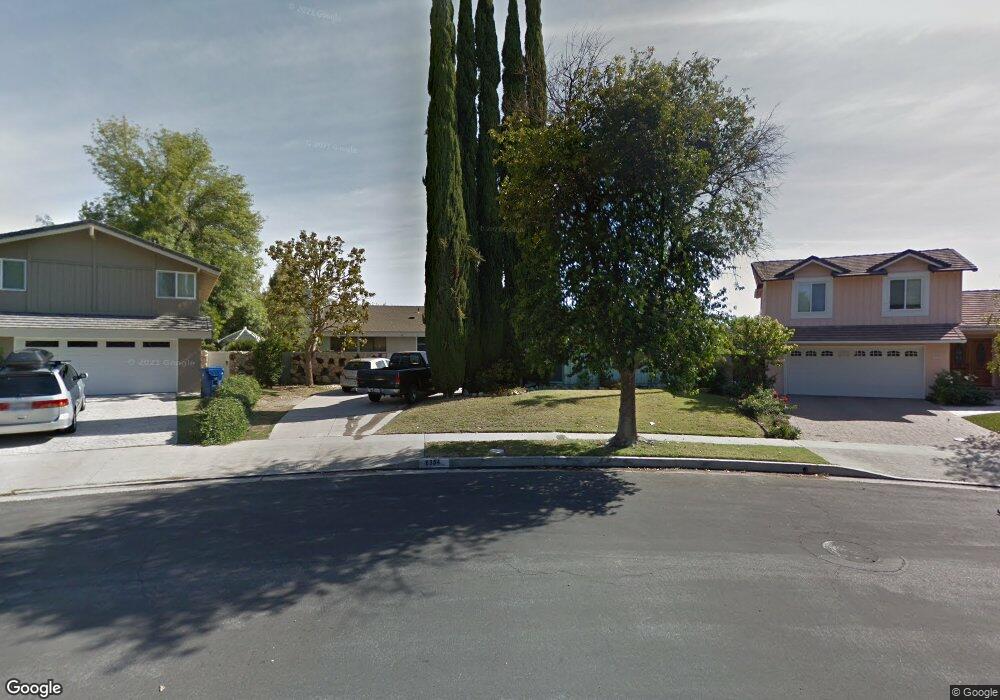
8354 Natalie Ln Canoga Park, CA 91304
Canoga Park NeighborhoodEstimated Value: $1,183,000 - $1,396,000
4
Beds
3
Baths
2,128
Sq Ft
$608/Sq Ft
Est. Value
About This Home
This home is located at 8354 Natalie Ln, Canoga Park, CA 91304 and is currently estimated at $1,293,194, approximately $607 per square foot. 8354 Natalie Ln is a home located in Los Angeles County with nearby schools including Christopher Columbus Middle School, Justice Street Academy Charter, and Pomelo Community Charter.
Ownership History
Date
Name
Owned For
Owner Type
Purchase Details
Closed on
Jun 26, 2023
Sold by
James And Kiene Landry Trust
Bought by
Wright Matthew
Current Estimated Value
Home Financials for this Owner
Home Financials are based on the most recent Mortgage that was taken out on this home.
Original Mortgage
$920,000
Outstanding Balance
$891,950
Interest Rate
5.88%
Mortgage Type
New Conventional
Estimated Equity
$401,244
Purchase Details
Closed on
Aug 9, 2022
Sold by
Landry James M and Landry Kiene M
Bought by
James And Kiene Landry Trust and Landry
Purchase Details
Closed on
Feb 9, 1995
Sold by
Rosen Jerome E and Rosen Sherry D
Bought by
Landry James M and Kiene Landry M
Home Financials for this Owner
Home Financials are based on the most recent Mortgage that was taken out on this home.
Original Mortgage
$228,600
Interest Rate
9.09%
Mortgage Type
Purchase Money Mortgage
Create a Home Valuation Report for This Property
The Home Valuation Report is an in-depth analysis detailing your home's value as well as a comparison with similar homes in the area
Home Values in the Area
Average Home Value in this Area
Purchase History
| Date | Buyer | Sale Price | Title Company |
|---|---|---|---|
| Wright Matthew | $1,150,000 | First American Title | |
| James And Kiene Landry Trust | -- | None Listed On Document | |
| Landry James M | -- | None Listed On Document | |
| Landry James M | $254,000 | Gateway Title Co |
Source: Public Records
Mortgage History
| Date | Status | Borrower | Loan Amount |
|---|---|---|---|
| Open | Wright Matthew | $920,000 | |
| Previous Owner | Landry James M | $228,600 |
Source: Public Records
Tax History Compared to Growth
Tax History
| Year | Tax Paid | Tax Assessment Tax Assessment Total Assessment is a certain percentage of the fair market value that is determined by local assessors to be the total taxable value of land and additions on the property. | Land | Improvement |
|---|---|---|---|---|
| 2025 | $14,322 | $1,173,000 | $938,400 | $234,600 |
| 2024 | $14,322 | $1,150,000 | $920,000 | $230,000 |
| 2023 | $5,678 | $429,632 | $179,193 | $250,439 |
| 2022 | $5,428 | $421,209 | $175,680 | $245,529 |
| 2021 | $5,356 | $412,951 | $172,236 | $240,715 |
| 2019 | $5,204 | $400,704 | $167,128 | $233,576 |
| 2018 | $5,045 | $392,848 | $163,851 | $228,997 |
| 2016 | $4,609 | $360,386 | $157,490 | $202,896 |
| 2015 | $4,545 | $354,974 | $155,125 | $199,849 |
| 2014 | $4,575 | $348,022 | $152,087 | $195,935 |
Source: Public Records
Map
Nearby Homes
- 8373 Denise Ln
- 8404 Joan Ln
- 8324 Joan Ln
- 8108 Royer Ave
- 23200 Justice St
- 23546 Community St
- 22906 Lanark St
- 22824 W Olive Way
- 8225 Fallbrook Ave
- 8565 N Walnut Way
- 7925 Royer Ave
- 8208 Fallbrook Ave
- 23676 Justice St
- 7839 Lena Ave
- 22700 Baltar St
- 7729 Sedan Ave
- 23774 Burton St
- 8304 Mariposa Ct
- 23911 Homezell Dr
- 8300 Mariposa Ct
- 8354 Natalie Ln
- 8350 Natalie Ln
- 23231 Community St
- 8385 Woodlake Ave
- 8400 Natalie Ln
- 8346 Natalie Ln
- 8404 Natalie Ln
- 23235 Community St
- 8401 Natalie Ln
- 8371 Woodlake Ave
- 23230 Community St
- 8344 Natalie Ln
- 23239 Community St
- 8405 Natalie Ln
- 8391 Denise Ln
- 23236 Community St
- 8411 Denise Ln
- 8412 Natalie Ln
- 8395 Denise Ln
- 8387 Denise Ln