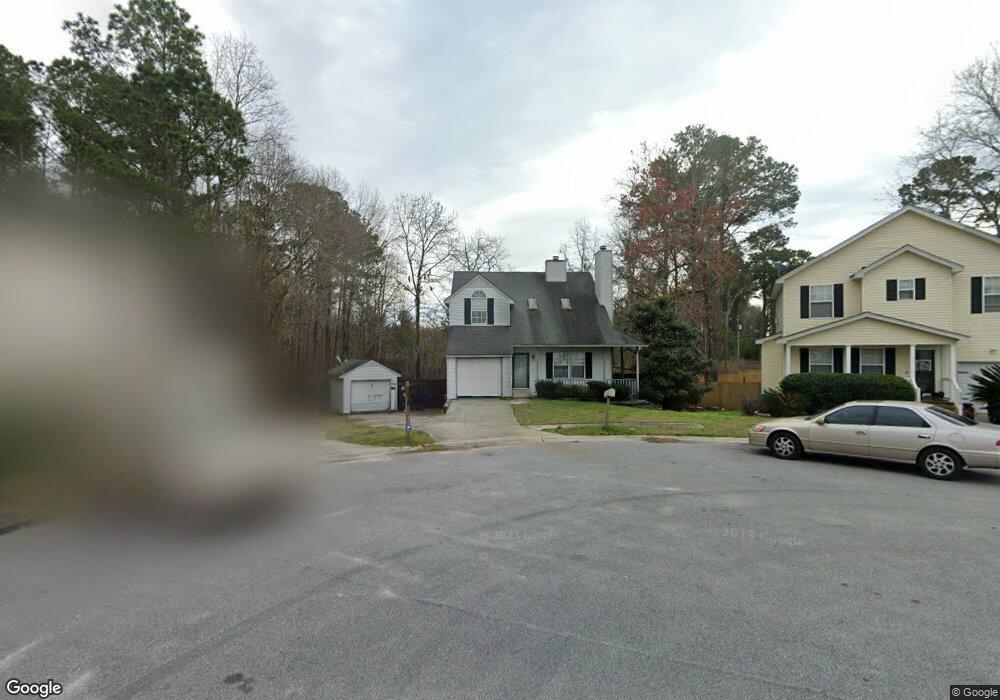
8354 Planters Knolls North Charleston, SC 29420
Estimated Value: $307,000 - $352,000
3
Beds
2
Baths
1,670
Sq Ft
$195/Sq Ft
Est. Value
About This Home
This home is located at 8354 Planters Knolls, North Charleston, SC 29420 and is currently estimated at $325,721, approximately $195 per square foot. 8354 Planters Knolls is a home located in Dorchester County with nearby schools including Windsor Hill Arts Infused Elementary School, River Oaks Middle School, and Fort Dorchester High School.
Ownership History
Date
Name
Owned For
Owner Type
Purchase Details
Closed on
Jan 10, 2023
Sold by
Bradford Home Buyers Llc
Bought by
Owens Kayla
Current Estimated Value
Home Financials for this Owner
Home Financials are based on the most recent Mortgage that was taken out on this home.
Original Mortgage
$286,150
Outstanding Balance
$276,964
Interest Rate
6.58%
Mortgage Type
New Conventional
Estimated Equity
$48,757
Purchase Details
Closed on
Jun 9, 2022
Sold by
Witcher Amory D
Bought by
Bradford Home Buyers Llc
Purchase Details
Closed on
Jun 8, 2022
Sold by
Witcher Tammie C
Bought by
Witcher Amory D
Purchase Details
Closed on
Apr 5, 2002
Sold by
Gilmore Richard K and Gilmore Kellie A
Bought by
Witcher Amory D and Witcher Tammie C
Purchase Details
Closed on
May 2, 2000
Sold by
Small Michael R and Small Lisa M
Bought by
Gilmore Kellie A and Gilmore Richard K
Create a Home Valuation Report for This Property
The Home Valuation Report is an in-depth analysis detailing your home's value as well as a comparison with similar homes in the area
Home Values in the Area
Average Home Value in this Area
Purchase History
| Date | Buyer | Sale Price | Title Company |
|---|---|---|---|
| Owens Kayla | $295,000 | -- | |
| Bradford Home Buyers Llc | $150,000 | Chard Law Firm Llc | |
| Witcher Amory D | -- | Chard Law Firm Llc | |
| Witcher Amory D | $122,000 | -- | |
| Gilmore Kellie A | $101,000 | -- |
Source: Public Records
Mortgage History
| Date | Status | Borrower | Loan Amount |
|---|---|---|---|
| Open | Owens Kayla | $286,150 | |
| Closed | Owens Kayla | $8,000 |
Source: Public Records
Tax History Compared to Growth
Tax History
| Year | Tax Paid | Tax Assessment Tax Assessment Total Assessment is a certain percentage of the fair market value that is determined by local assessors to be the total taxable value of land and additions on the property. | Land | Improvement |
|---|---|---|---|---|
| 2025 | $2,091 | $11,444 | $2,000 | $9,444 |
| 2024 | $2,091 | $11,444 | $2,000 | $9,444 |
| 2023 | $2,091 | $18,429 | $3,000 | $15,429 |
| 2022 | $4,003 | $10,690 | $1,380 | $9,310 |
| 2021 | $4,003 | $10,690 | $1,380 | $9,310 |
| 2020 | $3,881 | $9,300 | $1,200 | $8,100 |
| 2019 | $3,822 | $9,300 | $1,200 | $8,100 |
| 2018 | $3,248 | $9,300 | $1,200 | $8,100 |
| 2017 | $3,238 | $9,300 | $1,200 | $8,100 |
| 2016 | $3,190 | $9,300 | $1,200 | $8,100 |
| 2015 | $3,185 | $9,300 | $1,200 | $8,100 |
| 2014 | $3,027 | $149,730 | $0 | $0 |
| 2013 | -- | $8,980 | $0 | $0 |
Source: Public Records
Map
Nearby Homes
- 8113 Pleasant Ridge Dr
- 8248 Timberidge Ct
- 8201 Timberidge Ct
- 7654 Peppercorn Ln
- 8212 Continental Ct
- 7708 Peppercorn Ln
- 8105 Halifax Way
- 7719 Peppercorn Ln
- 7727 Picardy Place
- 7623 Hillandale Rd
- 8152 N Ridgebrook Dr
- 3419 Broadmoore Place
- 3452 Plaza Ln
- 4054 Cedars Pkwy Unit C
- 8151 N Ridgebrook Dr
- 8475 Scotts Mill Dr
- 7774 Ginger Ln
- 3354 Mountainbrook Ave
- 0 Old Hertz Rd Unit 25004561
- 0 Old Hertz Rd Unit 25004560
- 8354 Planters Knoll
- 8358 Planters Knolls
- 8350 Planters Knolls
- 7698 Hunters Ridge Ln
- 8346 Planters Knolls
- 8346 Planters Knoll
- 8359 Planters Knolls
- 7690 Hunters Ridge Ln
- 8351 Planters Knolls
- 8347 Planters Knoll
- 84 Hunters Ridge Ln
- 8349 Planters
- 8355 Planters Knolls
- 8349 Planters Knolls
- 82 Hunters Ridge Ln
- 82 Hunters Ridge Ln Unit AD
- 82 Hunters Ridge Ln Unit ABCD
- 8340 Planters Knolls
- 76 Hunters Ridge Ln
- 76 Hunters Ridge Ln Unit AD