
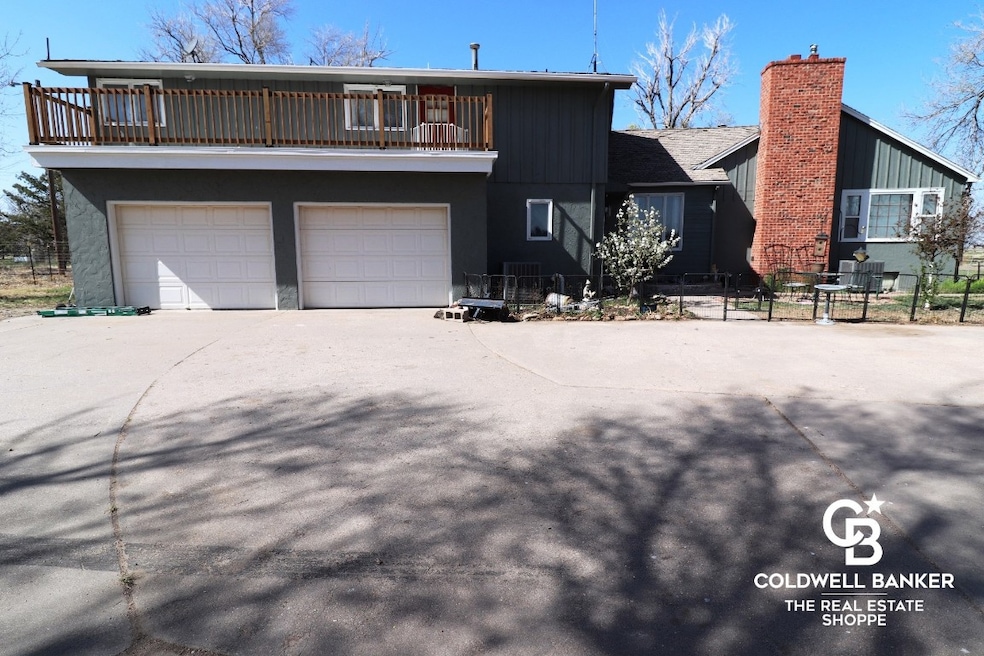

8355 N Big Lowe Rd Holcomb, KS 67851
Estimated payment $2,780/month
Total Views
13,124
6
Beds
3
Baths
3,164
Sq Ft
$147
Price per Sq Ft
Highlights
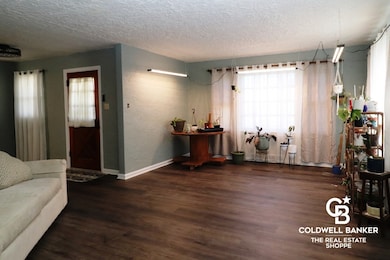
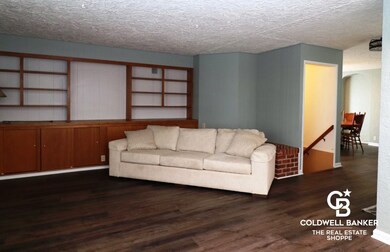
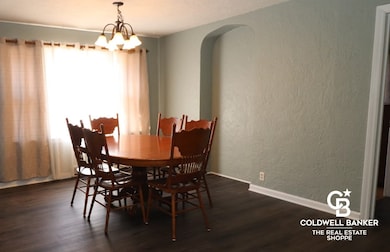
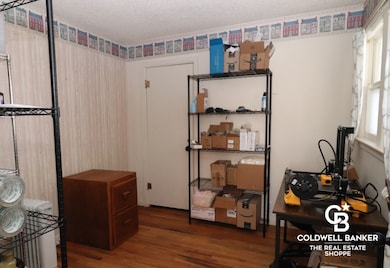
- Wood Flooring
- No HOA
- Wood Frame Window
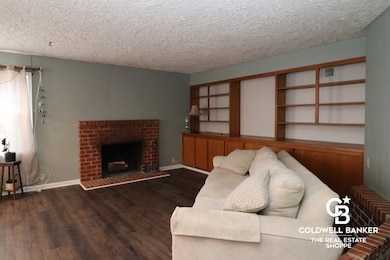
- 2 Fireplaces
- Balcony
- 2 Car Attached Garage
About This Home
Updates too numerus to name!! Don't miss out this amazing country home full of character sitting on 2.3 acres and with blacktop access to the drive and multiple from Holcomb, Garden City, and Scott City. Over 3100 sqft of living space not including the basement!! Perfect for large or growing families, boasting 6 bedrooms, 3 bathrooms, and 3 living areas!(one currently used as a recreational room). Huge main suite on the upper level with a balcony and big closets. Tons of updates including newly remodeled bathrooms, updated flooring on the main level, and new exterior paint. This house also includes a 32x60 steel frame shop with office/man cave and a 3/4 bathroom. Only 6 minutes from Holcomb or 15 minutes from Garden City! Sellers are offering $15,000 to buyers for their use as needed. Sellers are offering $15,000 to buyers for their use as needed.
Listing Agent
Coldwell Banker The Real Estate Shoppe License #SP00227404 Listed on: 04/15/2025
Home Details
Home Type
- Single Family
Est. Annual Taxes
- $3,904
Year Built
- Built in 1949
Lot Details
- 2.3 Acre Lot
- Fenced
- Zoning described as SE
Parking
- 2 Car Attached Garage
Home Design
- Split Level Home
- Brick Veneer
- Wood Roof
- Composition Roof
- Wood Siding
- Stucco
Interior Spaces
- 3,164 Sq Ft Home
- 1.5-Story Property
- 2 Fireplaces
- Wood Burning Fireplace
- Wood Frame Window
- Laundry on main level
Kitchen
- Electric Oven
- Electric Range
- Microwave
- Dishwasher
Flooring
- Wood
- Carpet
- Ceramic Tile
- Vinyl
Bedrooms and Bathrooms
- 6 Bedrooms
Partially Finished Basement
- Partial Basement
- Crawl Space
Outdoor Features
- Balcony
- Patio
Utilities
- Forced Air Heating and Cooling System
- Heating System Uses Natural Gas
- Private Water Source
- Well
- Septic Tank
Community Details
- No Home Owners Association
Listing and Financial Details
- Assessor Parcel Number 241-12-0-00-00-004-00-0
Map
Create a Home Valuation Report for This Property
The Home Valuation Report is an in-depth analysis detailing your home's value as well as a comparison with similar homes in the area
Home Values in the Area
Average Home Value in this Area
Tax History
| Year | Tax Paid | Tax Assessment Tax Assessment Total Assessment is a certain percentage of the fair market value that is determined by local assessors to be the total taxable value of land and additions on the property. | Land | Improvement |
|---|---|---|---|---|
| 2024 | $3,905 | $30,539 | $1,213 | $29,326 |
| 2023 | $3,905 | $32,810 | $1,139 | $31,671 |
| 2022 | $3,498 | $27,611 | $1,139 | $26,472 |
| 2021 | $2,861 | $22,048 | $1,051 | $20,997 |
| 2020 | $3,023 | $23,644 | $1,051 | $22,593 |
| 2019 | $2,490 | $20,013 | $949 | $19,064 |
| 2018 | $2,290 | $18,704 | $949 | $17,755 |
| 2017 | $2,187 | $0 | $0 | $0 |
| 2016 | $2,092 | $0 | $0 | $0 |
| 2015 | $2,219 | $0 | $0 | $0 |
| 2012 | -- | $0 | $0 | $0 |
Source: Public Records
Property History
| Date | Event | Price | Change | Sq Ft Price |
|---|---|---|---|---|
| 06/27/2025 06/27/25 | Price Changed | $464,900 | -2.1% | $147 / Sq Ft |
| 04/15/2025 04/15/25 | For Sale | $475,000 | +107.0% | $150 / Sq Ft |
| 05/29/2014 05/29/14 | Sold | -- | -- | -- |
| 08/24/2013 08/24/13 | Pending | -- | -- | -- |
| 04/29/2013 04/29/13 | For Sale | $229,500 | -- | $73 / Sq Ft |
Source: Garden City Board of REALTORS®
Purchase History
| Date | Type | Sale Price | Title Company |
|---|---|---|---|
| Quit Claim Deed | -- | None Listed On Document | |
| Warranty Deed | -- | First American Title | |
| Quit Claim Deed | -- | None Available |
Source: Public Records
Mortgage History
| Date | Status | Loan Amount | Loan Type |
|---|---|---|---|
| Open | $50,000 | Credit Line Revolving | |
| Previous Owner | $200,000 | New Conventional | |
| Previous Owner | $158,800 | New Conventional | |
| Previous Owner | $166,674 | FHA | |
| Previous Owner | $23,000 | New Conventional | |
| Previous Owner | $15,000 | Stand Alone Second |
Source: Public Records
About the Listing Agent
I am a GARDEN CITY native, born and raised in Kansas. Growing up, I was always involved with Extracurricular activities through school and church. My current hobbies include spending time with my family, traveling, and volunteering with various organizations.
Fred's Other Listings
Source: Garden City Board of REALTORS®
MLS Number: 100395
APN: 241-12-0-00-00-004.00-0
Nearby Homes
- 1370 Ogden Ct
- 401 E Jones Ave
- 13815 N Ritchel Rd
- 1315 Randall Rd
- 102 Jeremy Ln
- 603 Jake St
- 205 Prairie Ln
- 207 Barber Ave
- 204 Sydnee Ln
- 206 Sydnee Ln
- 302 Oldweiler Dr
- 310 Oldweiler Dr
- 401 Prairie Ln
- 4320 W Jones Ave
- 1990 N Chmelka Rd
- 1998 N Chmelka Rd
- 5925 Koehn Ave
- 000 W 2 of 32 and Se 4 of 29 -22-32 Finney Co Ks
- 1310 N Randle Rd
- 1255 N Randle Rd