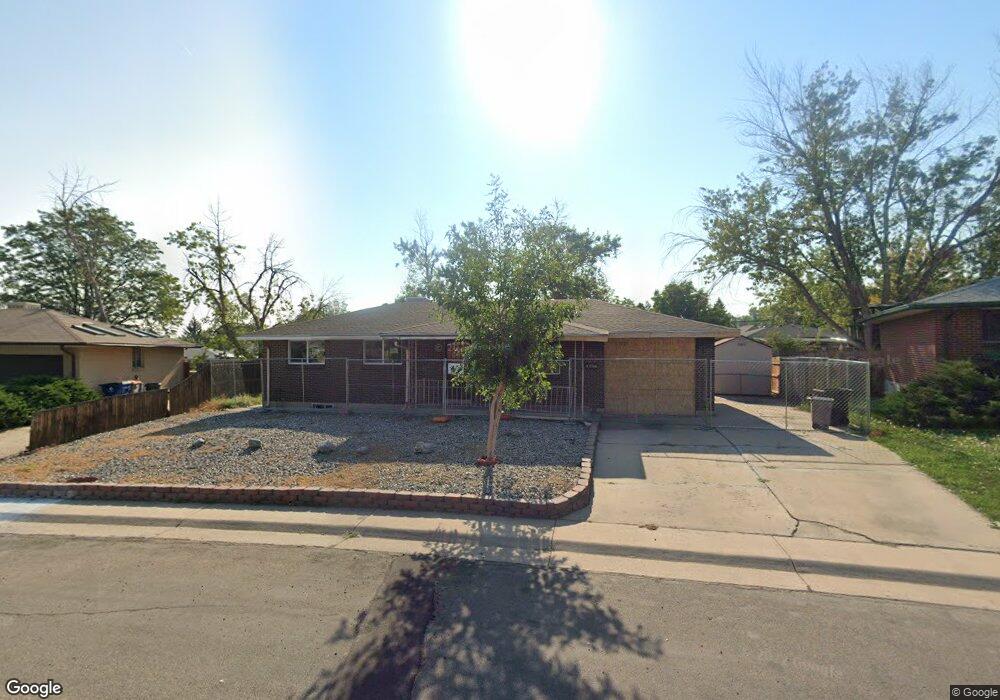
8356 Osage Way Denver, CO 80221
Sherrelwood NeighborhoodEstimated Value: $391,000 - $507,000
5
Beds
2
Baths
1,800
Sq Ft
$248/Sq Ft
Est. Value
About This Home
This home is located at 8356 Osage Way, Denver, CO 80221 and is currently estimated at $447,117, approximately $248 per square foot. 8356 Osage Way is a home located in Adams County with nearby schools including Sherrelwood Elementary School, Iver C. Ranum Middle School, and Westminster High School.
Ownership History
Date
Name
Owned For
Owner Type
Purchase Details
Closed on
Mar 20, 2007
Sold by
Hud
Bought by
Gandara Josefina
Current Estimated Value
Purchase Details
Closed on
Nov 21, 2006
Sold by
Us Bank Na
Bought by
Hud
Purchase Details
Closed on
Oct 25, 2006
Sold by
Lopez David
Bought by
U S Bank Na
Purchase Details
Closed on
Apr 21, 2005
Sold by
Schneider Melvin E
Bought by
Lopez David
Home Financials for this Owner
Home Financials are based on the most recent Mortgage that was taken out on this home.
Original Mortgage
$194,940
Interest Rate
5.89%
Mortgage Type
FHA
Create a Home Valuation Report for This Property
The Home Valuation Report is an in-depth analysis detailing your home's value as well as a comparison with similar homes in the area
Home Values in the Area
Average Home Value in this Area
Purchase History
| Date | Buyer | Sale Price | Title Company |
|---|---|---|---|
| Gandara Josefina | -- | None Available | |
| Hud | $193,460 | None Available | |
| U S Bank Na | -- | None Available | |
| Lopez David | $198,000 | -- |
Source: Public Records
Mortgage History
| Date | Status | Borrower | Loan Amount |
|---|---|---|---|
| Previous Owner | Lopez David | $194,940 |
Source: Public Records
Tax History Compared to Growth
Tax History
| Year | Tax Paid | Tax Assessment Tax Assessment Total Assessment is a certain percentage of the fair market value that is determined by local assessors to be the total taxable value of land and additions on the property. | Land | Improvement |
|---|---|---|---|---|
| 2024 | $3,005 | $26,690 | $5,500 | $21,190 |
| 2023 | $2,988 | $30,300 | $5,610 | $24,690 |
| 2022 | $2,893 | $24,300 | $5,770 | $18,530 |
| 2021 | $2,958 | $24,300 | $5,770 | $18,530 |
| 2020 | $2,787 | $23,310 | $5,930 | $17,380 |
| 2019 | $2,780 | $23,310 | $5,930 | $17,380 |
| 2018 | $2,141 | $17,850 | $5,400 | $12,450 |
| 2017 | $1,870 | $17,850 | $5,400 | $12,450 |
| 2016 | $1,529 | $13,850 | $2,950 | $10,900 |
| 2015 | $1,528 | $13,850 | $2,950 | $10,900 |
| 2014 | $1,383 | $12,140 | $2,390 | $9,750 |
Source: Public Records
Map
Nearby Homes
- 8243 Adams Way
- 8166 Nola Dr
- 8353 Adams Way
- 1401 W 85th Ave Unit B302
- 1401 W 85th Ave Unit D103
- 1440 Kokai Cir
- 8458 Jason Ct
- 8250 Ralph Ln
- 4809 N Tejon St
- 4815 N Tejon St
- 1101 Milky Way
- 2005 W 86th Ave
- 8613 Santa fe Dr
- 8746 Mariposa St
- 7961 Granada Rd
- 8268 Loretta Dr
- 8330 Zuni St Unit 214
- 8330 Zuni St Unit 212
- 8330 Zuni St Unit 117
- 8330 Zuni St Unit 109
- 8346 Osage Way
- 8366 Osage Way
- 8355 Charlotte Way
- 8365 Charlotte Way
- 8345 Charlotte Way
- 8375 Charlotte Way
- 8367 Osage Way
- 8376 Osage Way
- 8336 Osage Way
- 8335 Charlotte Way
- 8357 Osage Way
- 8377 Osage Way
- 8385 Charlotte Way
- 8386 Osage Way
- 8326 Osage Way
- 8325 Charlotte Way
- 8354 Charlotte Way
- 8344 Charlotte Way
- 8387 Osage Way
- 8395 Charlotte Way