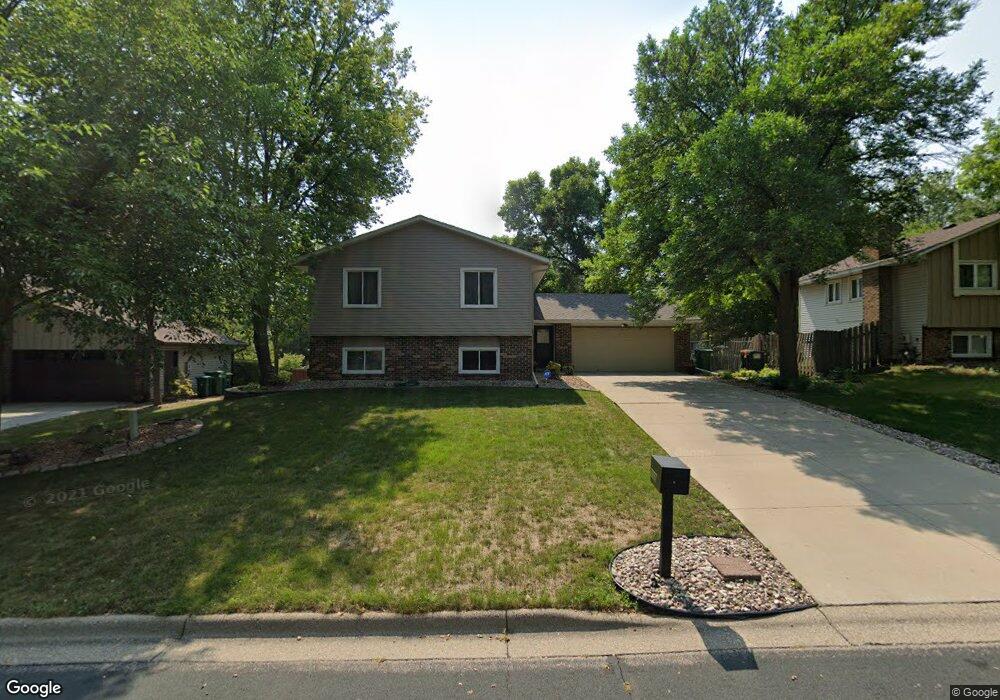
8359 W 101st Street Cir Bloomington, MN 55438
West Bloomington NeighborhoodEstimated Value: $437,159 - $472,000
5
Beds
3
Baths
1,287
Sq Ft
$356/Sq Ft
Est. Value
About This Home
This home is located at 8359 W 101st Street Cir, Bloomington, MN 55438 and is currently estimated at $458,790, approximately $356 per square foot. 8359 W 101st Street Cir is a home located in Hennepin County with nearby schools including Poplar Bridge Elementary School, Olson Middle School, and Jefferson Senior High School.
Ownership History
Date
Name
Owned For
Owner Type
Purchase Details
Closed on
Dec 29, 2017
Sold by
Bachmeyer Keenan Andrew and Bachmeyer Anne P
Bought by
Derring Benjamin J and Derring Laura K
Current Estimated Value
Home Financials for this Owner
Home Financials are based on the most recent Mortgage that was taken out on this home.
Original Mortgage
$252,800
Outstanding Balance
$213,115
Interest Rate
3.9%
Mortgage Type
New Conventional
Estimated Equity
$245,675
Purchase Details
Closed on
Nov 12, 2015
Sold by
Lee Yuk Fong and Lee Li Ping
Bought by
Bachmeyer Keenan Andrew and Bachmeyer Anne P
Home Financials for this Owner
Home Financials are based on the most recent Mortgage that was taken out on this home.
Original Mortgage
$279,943
Interest Rate
3.74%
Mortgage Type
VA
Purchase Details
Closed on
Jun 2, 2004
Sold by
Tso Kwok Leung and Tso Linda
Bought by
Lee Li Ping and Lee Yuk Fong
Create a Home Valuation Report for This Property
The Home Valuation Report is an in-depth analysis detailing your home's value as well as a comparison with similar homes in the area
Home Values in the Area
Average Home Value in this Area
Purchase History
| Date | Buyer | Sale Price | Title Company |
|---|---|---|---|
| Derring Benjamin J | $316,000 | First American Title Ins Co | |
| Deering Benjamin J | $316,000 | First American Title Ins Co | |
| Bachmeyer Keenan Andrew | $271,000 | Burnet Title | |
| Bachmeyer Keenan Andrew | -- | Burnet Title | |
| Lee Li Ping | $110,000 | -- |
Source: Public Records
Mortgage History
| Date | Status | Borrower | Loan Amount |
|---|---|---|---|
| Open | Deering Benjamin J | $252,800 | |
| Closed | Derring Benjamin J | $252,800 | |
| Previous Owner | Bachmeyer Keenan Andrew | $279,943 |
Source: Public Records
Tax History Compared to Growth
Tax History
| Year | Tax Paid | Tax Assessment Tax Assessment Total Assessment is a certain percentage of the fair market value that is determined by local assessors to be the total taxable value of land and additions on the property. | Land | Improvement |
|---|---|---|---|---|
| 2024 | $5,339 | $416,200 | $166,100 | $250,100 |
| 2023 | $5,178 | $426,700 | $176,600 | $250,100 |
| 2022 | $4,262 | $402,700 | $155,600 | $247,100 |
| 2021 | $4,026 | $335,300 | $137,000 | $198,300 |
| 2020 | $4,120 | $321,000 | $133,100 | $187,900 |
| 2019 | $3,915 | $319,300 | $133,100 | $186,200 |
| 2018 | $3,680 | $299,600 | $132,900 | $166,700 |
| 2017 | $3,492 | $266,200 | $119,300 | $146,900 |
| 2016 | $3,483 | $253,500 | $110,300 | $143,200 |
| 2015 | $3,381 | $238,400 | $107,000 | $131,400 |
| 2014 | -- | $221,300 | $103,700 | $117,600 |
Source: Public Records
Map
Nearby Homes
- 8149 W 103rd St
- 10405 Decatur Ave S
- 10434 Decatur Ave S
- 9775 Dorset Ln
- 9767 Dorset Ln
- 10462 Decatur Ave S
- 9863 Balmoral Ln
- 10170 Utah Ave S
- 10417 Fawns Way
- 9579 Falcons Way
- 9991 Dunberry Cir
- xxxx Linden Dr
- 7501 W 101st St Unit 310
- 7501 W 101st St Unit 107
- 8434 W 97th St
- 7651 Bush Lake Dr
- 9645 Ensign Cir
- 10246 Lee Dr
- 10433 Utah Rd
- 10326 Balsam Ln
- 8351 W 101st Street Cir
- 10142 Boone Cir
- 8401 W 101st Street Cir
- 10144 Boone Cir
- 10140 Boone Cir
- 8358 W 101st Street Cir
- 8350 W 101st Street Cir
- 10146 Boone Cir
- 8366 W 101st Street Cir
- 8409 W 101st Street Cir
- 8400 W 101st Street Cir
- 10148 Boone Cir
- 10131 Boone Cir
- 8417 W 101st Street Cir
- 8408 W 101st Street Cir
- 8417 W 101st Street Cir
- 8357 W 100th St
- 10150 Boone Cir
- 8355 W 100th St
- 8359 W 100th St