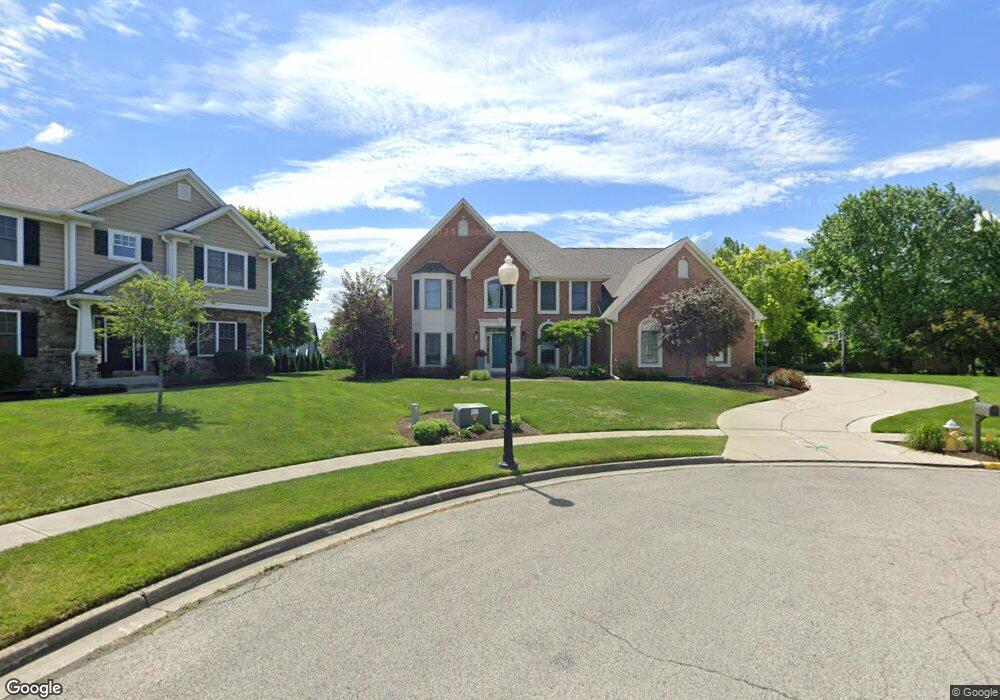
836 Beechwood Dr Tipp City, OH 45371
Estimated Value: $608,341 - $681,000
4
Beds
5
Baths
3,938
Sq Ft
$167/Sq Ft
Est. Value
About This Home
This home is located at 836 Beechwood Dr, Tipp City, OH 45371 and is currently estimated at $657,835, approximately $167 per square foot. 836 Beechwood Dr is a home located in Miami County with nearby schools including Broadway Elementary School, Nevin Coppock Elementary School, and L. T. Ball Intermediate School.
Ownership History
Date
Name
Owned For
Owner Type
Purchase Details
Closed on
Mar 16, 2012
Sold by
Barbour Donald S and Barbour Leslie J
Bought by
Stacy Jane N and Stacy Ryan A
Current Estimated Value
Home Financials for this Owner
Home Financials are based on the most recent Mortgage that was taken out on this home.
Original Mortgage
$308,550
Outstanding Balance
$211,851
Interest Rate
3.86%
Mortgage Type
New Conventional
Estimated Equity
$445,984
Purchase Details
Closed on
Nov 22, 2011
Sold by
Barbour Donald S and Barbour Leslie J
Bought by
Stacy Jane N and Stacy Ryan A
Home Financials for this Owner
Home Financials are based on the most recent Mortgage that was taken out on this home.
Original Mortgage
$308,550
Interest Rate
3.86%
Mortgage Type
New Conventional
Purchase Details
Closed on
Jul 7, 2004
Sold by
Sacks Fred M and Sacks Becky B
Bought by
Barbour Donald S and Barbour Leslie J
Home Financials for this Owner
Home Financials are based on the most recent Mortgage that was taken out on this home.
Original Mortgage
$290,000
Interest Rate
6.39%
Mortgage Type
New Conventional
Create a Home Valuation Report for This Property
The Home Valuation Report is an in-depth analysis detailing your home's value as well as a comparison with similar homes in the area
Home Values in the Area
Average Home Value in this Area
Purchase History
| Date | Buyer | Sale Price | Title Company |
|---|---|---|---|
| Stacy Jane N | $363,000 | -- | |
| Stacy Jane N | $363,000 | -- | |
| Barbour Donald S | $490,000 | -- |
Source: Public Records
Mortgage History
| Date | Status | Borrower | Loan Amount |
|---|---|---|---|
| Open | Barbour Donald S | $308,550 | |
| Previous Owner | Stacy Jane N | $308,550 | |
| Previous Owner | Barbour Donald S | $290,000 |
Source: Public Records
Tax History Compared to Growth
Tax History
| Year | Tax Paid | Tax Assessment Tax Assessment Total Assessment is a certain percentage of the fair market value that is determined by local assessors to be the total taxable value of land and additions on the property. | Land | Improvement |
|---|---|---|---|---|
| 2024 | $8,480 | $170,350 | $23,100 | $147,250 |
| 2023 | $8,480 | $170,350 | $23,100 | $147,250 |
| 2022 | $7,730 | $170,350 | $23,100 | $147,250 |
| 2021 | $7,104 | $141,960 | $19,250 | $122,710 |
| 2020 | $7,191 | $141,960 | $19,250 | $122,710 |
| 2019 | $7,256 | $141,960 | $19,250 | $122,710 |
| 2018 | $7,340 | $134,020 | $21,180 | $112,840 |
| 2017 | $7,368 | $134,020 | $21,180 | $112,840 |
| 2016 | $7,121 | $134,020 | $21,180 | $112,840 |
| 2015 | $6,218 | $124,080 | $19,600 | $104,480 |
| 2014 | $6,218 | $124,080 | $19,600 | $104,480 |
| 2013 | $6,250 | $124,080 | $19,600 | $104,480 |
Source: Public Records
Map
Nearby Homes
- 625 Lantana Ct
- 549 Whispering Pines Ave
- 582 Storm Ct
- 919 Cypress Place
- 5166 Catalpa Dr
- 465 Cayman Cir
- 536 Michael Place
- 703 Nelson Ct
- 760 Rosedale Dr
- 850 Todd Ct
- 635 Kitrina Ave Unit B
- 239 W Elm St
- 36 Wilhelm St
- 100 Wunderwood Dr
- 514 S 3rd St
- 36 Regency Square
- 423 S 2nd St
- 1117 Honeydew Dr
- 1109 Honeydew Dr
- 559 W Broadway St
- 822 Beechwood Dr
- 601 Revelstoke Ct
- 663 Whispering Pines Ave
- 837 Beechwood Dr
- 818 Beechwood Dr
- 795 Hickory Hill Dr
- 617 Revelstoke Ct
- 823 Beechwood Dr
- 819 Beechwood Dr
- 608 Revelstoke Ct
- 653 Whispering Pines Ave
- 802 Beechwood Dr
- 662 Primrose Ln
- 835 Hickory Hill Dr
- 654 Primrose Ln
- 623 Revelstoke Ct
- 616 Brookmere Ave
- 670 Primrose Ln
- 620 Revelstoke Ct
- 810 Hickory Hill Dr