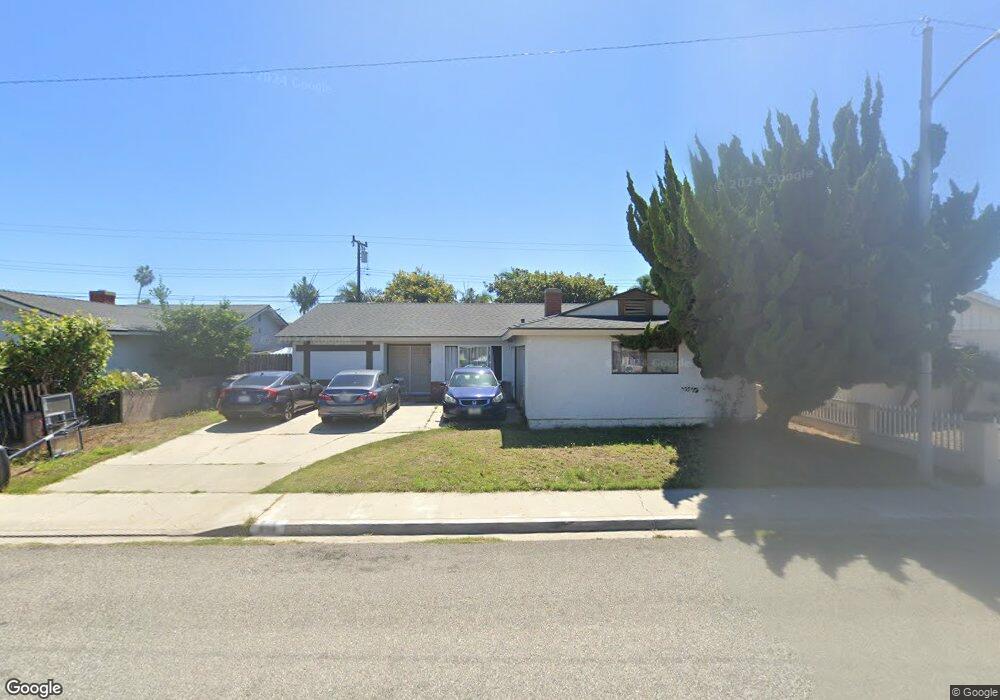
836 Borrego Way Oxnard, CA 93033
Blackstock South NeighborhoodEstimated Value: $668,757 - $752,000
4
Beds
2
Baths
1,588
Sq Ft
$442/Sq Ft
Est. Value
About This Home
This home is located at 836 Borrego Way, Oxnard, CA 93033 and is currently estimated at $701,689, approximately $441 per square foot. 836 Borrego Way is a home located in Ventura County with nearby schools including Fred L. Williams Elementary School and Channel Islands High School.
Ownership History
Date
Name
Owned For
Owner Type
Purchase Details
Closed on
Jan 8, 1998
Sold by
Cordova Lourdes
Bought by
Cordova Pasqual Joaquin
Current Estimated Value
Home Financials for this Owner
Home Financials are based on the most recent Mortgage that was taken out on this home.
Original Mortgage
$156,577
Outstanding Balance
$26,719
Interest Rate
6.95%
Estimated Equity
$674,970
Purchase Details
Closed on
Jan 6, 1998
Sold by
Joaquin Cordova Pasqual
Bought by
Torres Carlos
Home Financials for this Owner
Home Financials are based on the most recent Mortgage that was taken out on this home.
Original Mortgage
$156,577
Outstanding Balance
$26,719
Interest Rate
6.95%
Estimated Equity
$674,970
Purchase Details
Closed on
Dec 15, 1994
Sold by
Cordova Lourdes M
Bought by
Cordova Pasqual Joaquin
Home Financials for this Owner
Home Financials are based on the most recent Mortgage that was taken out on this home.
Original Mortgage
$80,000
Interest Rate
9.2%
Create a Home Valuation Report for This Property
The Home Valuation Report is an in-depth analysis detailing your home's value as well as a comparison with similar homes in the area
Home Values in the Area
Average Home Value in this Area
Purchase History
| Date | Buyer | Sale Price | Title Company |
|---|---|---|---|
| Cordova Pasqual Joaquin | -- | First American Title Ins Co | |
| Torres Carlos | $160,000 | First American Title Ins Co | |
| Cordova Pasqual Joaquin | -- | Fidelity National Title |
Source: Public Records
Mortgage History
| Date | Status | Borrower | Loan Amount |
|---|---|---|---|
| Open | Torres Carlos | $156,577 | |
| Previous Owner | Cordova Pasqual Joaquin | $80,000 |
Source: Public Records
Tax History
| Year | Tax Paid | Tax Assessment Tax Assessment Total Assessment is a certain percentage of the fair market value that is determined by local assessors to be the total taxable value of land and additions on the property. | Land | Improvement |
|---|---|---|---|---|
| 2025 | $2,991 | $255,443 | $102,176 | $153,267 |
| 2024 | $2,991 | $250,435 | $100,173 | $150,262 |
| 2023 | $2,815 | $245,525 | $98,209 | $147,316 |
| 2022 | $2,756 | $240,711 | $96,283 | $144,428 |
| 2021 | $2,788 | $235,992 | $94,395 | $141,597 |
| 2020 | $2,838 | $233,574 | $93,428 | $140,146 |
| 2019 | $2,752 | $228,996 | $91,597 | $137,399 |
| 2018 | $2,650 | $224,506 | $89,801 | $134,705 |
| 2017 | $2,563 | $220,105 | $88,041 | $132,064 |
| 2016 | $2,440 | $215,790 | $86,315 | $129,475 |
| 2015 | $2,476 | $212,550 | $85,019 | $127,531 |
| 2014 | $2,447 | $208,388 | $83,354 | $125,034 |
Source: Public Records
Map
Nearby Homes
- 4160 Petit Dr Unit 39
- 4340 Highland Ave
- 360 Ibsen Place Unit 129
- 320 Columbia Place Unit 46
- 1630 Nelson Place
- 4710 Clover Dr
- 3631 La Costa Place
- 4731 Hamilton Ave
- 4910 Justin Way
- 1036 Cheyenne Way
- 3630 Dallas Dr
- 4614 Concord Way
- 167 Hughes Dr
- 5117 Jefferson Square
- 168 Lark St
- 5222 Longfellow Way
- 2021 E Bard Rd
- 5225 Columbus Place
- 5302 Barrymore Dr
- 1928 San Benito St
- 830 Borrego Way
- 840 Borrego Way
- 841 Avalon Way
- 835 Avalon Way
- 820 Borrego Way
- 845 Avalon Way
- 850 Borrego Way
- 825 Avalon Way
- 835 Borrego Way
- 831 Borrego Way
- 841 Borrego Way
- 851 Avalon Way
- 821 Borrego Way
- 816 Borrego Way
- 815 Avalon Way
- 860 Borrego Way
- 851 Borrego Way
- 861 Avalon Way
- 815 Borrego Way
- 811 Avalon Way
Your Personal Tour Guide
Ask me questions while you tour the home.